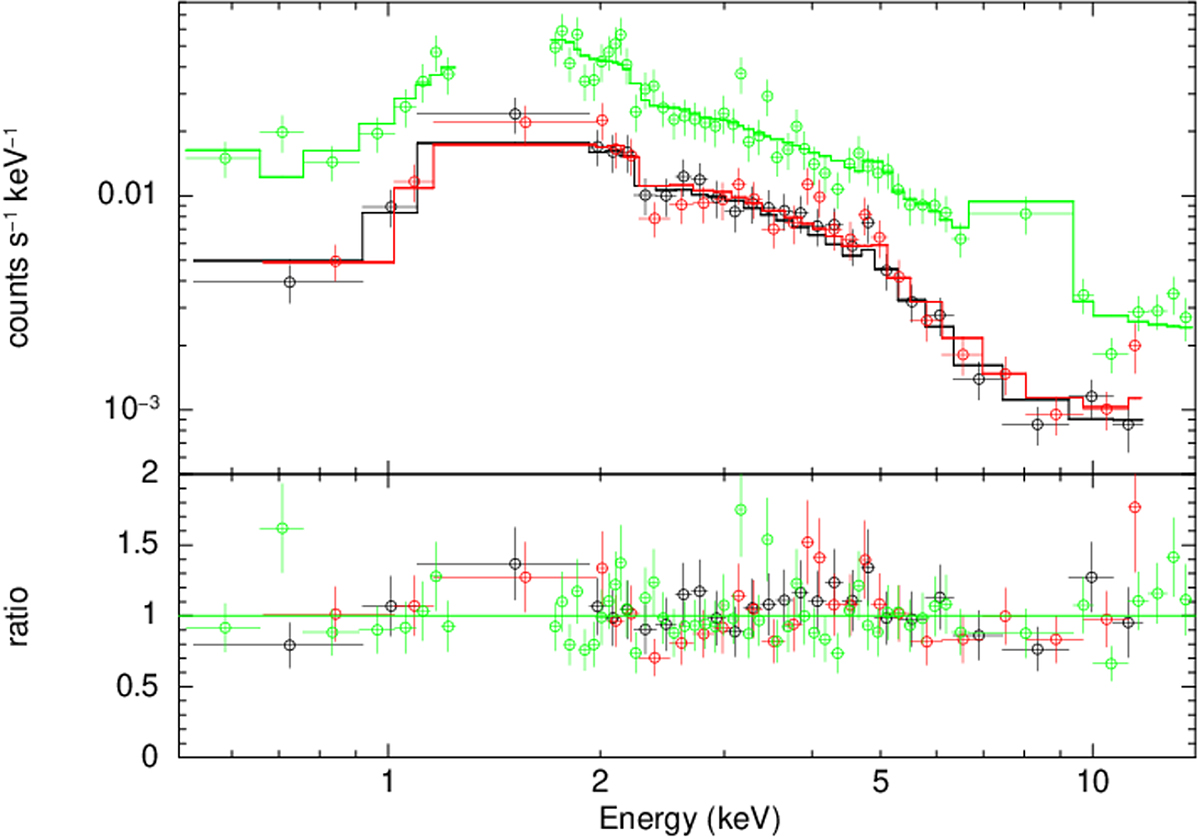
Fig. 1.
Download original image
Observed source spectrum (black = MOS1; red = MOS2; green = pn) with APEC best-fit model reported. The spectra of the different cameras and observations were fit jointly, but the results of a single ObsID (0923400401) were reported for clarity. For energy ranges 1.2−1.9 keV (for the MOS detectors) and 1.2−1.7 keV and 7−9.2 keV (for the pn detector) were excluded during the fit. Each spectral bin was re-binned to a minimum significance of 5σ for visualization purposes. Residuals in the pn spectrum at 2.1 keV are instrumental (Au lines; Leccardi & Molendi 2008).
Current usage metrics show cumulative count of Article Views (full-text article views including HTML views, PDF and ePub downloads, according to the available data) and Abstracts Views on Vision4Press platform.
Data correspond to usage on the plateform after 2015. The current usage metrics is available 48-96 hours after online publication and is updated daily on week days.
Initial download of the metrics may take a while.