| Issue |
A&A
Volume 708, April 2026
|
|
|---|---|---|
| Article Number | A154 | |
| Number of page(s) | 7 | |
| Section | Cosmology (including clusters of galaxies) | |
| DOI | https://doi.org/10.1051/0004-6361/202558647 | |
| Published online | 03 April 2026 | |
Multiwavelength insights into the pulsar wind nebula candidate near 1LHAASO J0343+5254u: An obscured merging galaxy cluster?
1
ASTRON, Netherlands Institute for Radio Astronomy, Oude Hoogeveensedijk 4, 7991 PD, Dwingeloo, The Netherlands
2
INAF – Istituto di Radioastronomia, Via P. Gobetti 101 Bologna, Italy
★ Corresponding author: This email address is being protected from spambots. You need JavaScript enabled to view it.
Received:
18
December
2025
Accepted:
2
March
2026
Abstract
Context. The advent of the Large High Altitude Air Shower Observatory (LHAASO) accelerated the detection of tera- and petaelectronvolt gamma-ray sources. Some of these are associated with pulsar wind nebulae (PWNe) and other Galactic objects, while others are yet to be connected to sources at other wavelengths. Recently, the discovery of an extended X-ray source within the unidentified PeV source 1LHAASO J0343+5254u was reported; this source was claimed as a candidate PWN based on its X-ray spectrum.
Aims. We aim to revisit the interpretation of the extended X-ray source based on multiwavelength observations.
Methods. We present new LOFAR continuum radio imaging at observing frequencies of 54 and 144 MHz, an alternative X-ray modeling, and archival near-infrared (NIR) data.
Results. We discover several radio sources with morphologies and spectra suggestive of a radio halo, a radio relic, and tailed radio galaxies, all of which are typically found in (merging) galaxy clusters. Furthermore, we show that the X-ray data can be modeled as thermal emission from the intracluster medium (ICM), with our best-fitting thermal ICM model being slightly preferred to a nonthermal power-law fit. We further find a 9.7σ overdensity in red NIR sources in the surrounding region, among them possible hosts of the tailed radio sources.
Conclusions. Our results favor an interpretation of the X-ray source as a massive, merging galaxy cluster located in a highly extinct region of the Galactic plane, unrelated to 1LHAASO J0343+5254u. Future observations in the hard X-ray regime will be able to conclusively settle the discussion on the nature of the X-ray emission.
Key words: galaxies: clusters: general / galaxies: clusters: intracluster medium / gamma rays: general / radio continuum: general / X-rays: galaxies: clusters
© The Authors 2026
 Open Access article, published by EDP Sciences, under the terms of the Creative Commons Attribution License (https://creativecommons.org/licenses/by/4.0), which permits unrestricted use, distribution, and reproduction in any medium, provided the original work is properly cited.
This article is published in open access under the Subscribe to Open model. This email address is being protected from spambots. You need JavaScript enabled to view it. to support open access publication.
1. Introduction
Ultra-high-energy (UHE; E > 100 TeV) gamma-rays, a long inaccessible window of the electromagnetic spectrum, are now routinely observed thanks to ground-based extensive air shower arrays, most notably the Large High Altitude Air Shower Observatory (LHAASO; Aharonian & An 2021). The recently published First LHAASO Catalog of Gamma-ray Sources (Cao et al. 2024) lists 90 sources with E > 0.1 TeV, 43 of which show UHE emission. The LHAASO results have called into question the long-held idea that supernova remnants were the main accelerators of cosmic rays (CRs) up to energies of a few petaelectronvolts (Hillas 2005). Despite many instances of ≤TeV gamma-ray sources being associated with supernova remnants, other sources, such as pulsar wind nebulae (PWNe; Abeysekara et al. 2019; Cao et al. 2021a), pulsar TeV halos (Linden et al. 2017; López-Coto et al. 2022), and superbubbles (Abeysekara et al. 2021) are now also contemplated as likely Galactic PeVatrons1, contributing non-negligible amounts to the total Galactic CR flux. There is strong community interest in understanding the nature of the LHAASO sources; this requires a multiwavelength approach.
In this context, DiKerby et al. (2025, hereafter DK25) observed a region in the Galactic plane toward l = 146.94°, b = −1.63° in the X-rays with XMM-Newton. This region contains two sources cataloged in Cao et al. (2024): 1LHAASO J0339+5307 and 1LHAASO J0343+5254u, originally published as the single source LHAASO J0341+5258 in Cao et al. (2021b). The latter of these two sources also shows UHE emission. As a result of their observing campaign, DK25 discovered the new X-ray source XMMU J034124.2+525720, centered at αJ2000 = 03h41m24s, δJ2000 = +52° 57′10″ and positionally coincident with the lower energy component of 1LHAASO J0343+5254u. This source is extended, and its spectrum was fit with a power-law model, suggesting that it may be a PWN. DK25 found no clear X-ray pulsations or radio counterpart, and no Fermi gamma-ray source at the source location. Based on the X-ray spectrum and morphology, they classified the X-ray source as a PWN candidate and a possible counterpart of the UHE source.
An alternative source of extended X-ray emission, not associated with UHE photons, is diffuse thermal emission from the ICM of a galaxy cluster. Deep within the Galactic plane, the strong absorption of soft X-rays (E < 2 keV) can cause the spectra of PWNe and galaxy clusters to resemble each other. This scenario was not explored by DK25, but considered as an alternative to a PWN origin by earlier studies of similar sources (Katsuda et al. 2012; Halpern & Gotthelf 2019). Radio observations provide an independent method for identifying highly obscured clusters, as they are not affected by Galactic extinction (Kollatschny et al. 2021). Radio emission in clusters can originate from cluster member galaxies. Tailed radio galaxies (TRG), which are shaped by their interaction with the ICM, are a typical phenomenon observed in clusters. Clusters can further show diffuse radio emission associated with merger activity (Cuciti et al. 2021). Depending on the morphology and location, diffuse cluster radio sources are classified as radio relics (elongated sources in the periphery) or radio halos (extended sources co-spatial to the X-ray emission; van Weeren et al. 2019). These sources have steep spectra (spectral indices α < −12).
On the other hand, the synchrotron emission of PWNe results from accelerated particles injected by its central pulsar. The emission mechanism is the same across many orders of magnitude, typically resulting in extended sources that shrink in size with increasing energy due to the effect of synchrotron losses. The morphology of the extended source can vary, showing shapes that are circular, elliptical, tailed, or irregular, but the emission is typically contiguous and overlaps with the location of the pulsar, which injects the emitting particles. The observed radio spectral indices for PWNe are in the −0.3 ≲ α ≲ 0 range (Gaensler & Slane 2006).
In this study, we revisited the classification of the X-ray source discovered by DK25 based on additional multifrequency data. We assumed a flat ΛCDM cosmology with Ωm = 0.3 and H0 = 70 km s−1 Mpc−1. This paper is organized as follows. In Sect. 2 we present our analysis of the X-ray, radio, and NIR data. We discuss our results in Sect. 3 and conclude in Sect. 4.
2. Observations and analysis
2.1. X-ray analysis
The region surrounding the 1LHAASO J0343+5254u was observed by XMM-Newton (IDs: 0923400401, 0923400801, and 0923401401) for ∼115 ks. These observations were originally presented in DK25. We reprocessed the data following the procedure of Bartalucci et al. (2023) using the Extended Source Analysis Software (ESAS; Snowden et al. 2008) within the XMM-Newton Scientific Analysis System (SAS v16.1). After filtering the observations for soft proton flares, we produced exposure-corrected EPIC images for each ObsID in the 0.5 − 7.0 keV band and combined them in a single mosaic. We note that XMMU J034124.2+525720 lies > 10 arcmin from the center of the observation, where the PSF of the instrument degrades.
DiKerby et al. (2025) modeled the X-ray spectrum of the extended emission with a power law. In this study, we investigated whether the data can instead be described as thermal emission from the ICM, using the same spectral extraction regions used in DK25 for both the source and the background. We first modeled the background following Sect. 4 of Rossetti et al. (2024). As DK25, we found that the Galactic NH value reported by HI4PI Collaboration (2016) does not yield a satisfactory fit; therefore, we allowed it to vary during the background modeling. Our best-fit value, which we adopted hereafter, is NH = 1.58 × 1022 cm−2; this is consistent within uncertainties with that found by DK25.
With the background model fixed, we proceeded to fit the spectrum of the primary source. Using a power-law model, we obtained a photon index of Γ = 1.75 ± 0.03, in agreement with DK25. As an alternative, we considered that the X-ray source is thermal emission from the ICM, which is represented by the APEC model (Smith et al. 2001). To obtain a robust fit given the data quality, we limited the number of free parameters of the model and assumed a typical metal abundance of Z = 0.3 Z⊙ (e.g., Molendi et al. 2016). The best-fitting APEC model has a temperature of  keV and a redshift of
  . The resulting statistics are C-stat./degrees of freedom = 1817.68/1798 for the power law (shown in Fig. B.1) and 1809.66/1797 for the APEC fit (shown in Fig. 1). Both models provide an acceptable description of the data, with the thermal model being slightly preferred (at a moderate significance of 2.8σ based on the likelihood ratio test). We also repeated the APEC fit leaving the metallicity unconstrained. The resulting best-fitting values are a temperature of
  keV, a redshift of
  , and a metallicity of
  (C-stat./d.o.f. 1808.85/1796), within uncertainties of the values found for the constrained fit.
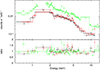 |
Fig. 1. Observed source spectrum (black = MOS1; red = MOS2; green = pn) with APEC best-fit model reported. The spectra of the different cameras and observations were fit jointly, but the results of a single ObsID (0923400401) were reported for clarity. For energy ranges 1.2−1.9 keV (for the MOS detectors) and 1.2−1.7 keV and 7−9.2 keV (for the pn detector) were excluded during the fit. Each spectral bin was re-binned to a minimum significance of 5σ for visualization purposes. Residuals in the pn spectrum at 2.1 keV are instrumental (Au lines; Leccardi & Molendi 2008). |
2.2. LOFAR imaging
The location of XMMU J034124.2+525720 is covered by the third data release of the LOFAR Two-metre Sky Survey (LoTSS; Shimwell et al. 2026) at 144 MHz as well as in the upcoming data release of the LOFAR Low-band Antenna Sky Survey (LoLSS; de Gasperin et al. 2023, and in prep.) at 54 MHz. The LoTSS map of the wider region surrounding the XMM and LHAASO sources is shown in Fig. 2. Extended radio sources are visible at the location of the X-ray source. For further analysis, we re-calibrated the LoTSS and LoLSS observations covering these extended radio sources. Details of the calibration are provided in Appendix A. In Fig. 3, we display the recalibrated 144 MHz map with the X-ray contours overlaid in cyan. A prominent, arc-like structure is visible toward the north, containing a region with increased surface brightness in the east. We also detected two tailed sources (white squares in the figure). We discovered faint diffuse emission co-spatial with the extended X-ray source. To highlight this diffuse emission, we created an image from the compact source-subtracted data at 30″ resolution, which we display in Appendix A. We measured the flux densities of these sources at 54 and 144 MHz and report them in Table 1. We also imaged the LoTSS data in circular polarization to check for the presence of a possible radio pulsar. No emission above 5σrms (500 μJy beam−1) was found.
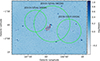 |
Fig. 2. LoTSS DR3 map of the wider area surrounding the LHAASO sources in Galactic coordinates. The central frequency is 144 MHz and the noise level is σrms = 100 μJy beam−1 at a resolution of 6″. The green circles show the 39% containment radius of the LHAASO sources, and the red contours mark the 0.5 − 7 keV emission around XMMU J034124.2+525720 smoothed to 20″ resolution, starting at 5 × 10⁻⁶ cts s−1 arcsec−2 and increasing in factors of two. |
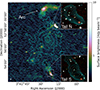 |
Fig. 3. Radio map at 144 MHz; the noise level is σrms = 100 μJy beam−1 at 5″ × 8″ resolution. In cyan we show the 0.5 − 7 keV X-ray contours. The insets show the NIR image with the radio contours of the tailed sources overlaid; red circles mark UGS galaxies. |
Flux densities and spectral indices.
Based on the LBA and HBA images, we investigated the spectral properties of the radio sources. The arc-shaped source has an integrated spectral index of α = −1.18 ± 0.15, while for the tailed sources we find values of α = −0.97 ± 0.15 and α = −0.93 ± 0.17 for the northern and southern sources, respectively. For the diffuse emission co-spatial to the X-rays, we found a steep spectrum of α = −1.36 ± 0.38. We also created a spectral index map (displayed in Fig. 4) from the 54 and 144 MHz images, as described in Appendix A. While its resolution and quality is limited by the 54 MHz data, we nevertheless find that the arc-like source generally features a flatter spectrum toward the north and a steeper spectrum toward the south, while the spectra of the two tailed sources are flat (α ∼ −0.5) toward the south and steep (α < −1) toward the north.
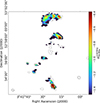 |
Fig. 4. Radio spectral index map at a resolution of 20″ × 13″. Gray contours correspond to 1 Jy beam−1 × [1, 2, 4, 8] in the 144 MHz map at the same resolution; black crosses mark the location of candidate IR host galaxies. |
2.3. UKIDSS GPS NIR galaxy density
We investigated the presence of possible NIR counterparts of the radio sources in the UKIDSS Galactic Plane Survey (UGS; Lucas et al. 2008). While no prominent galaxies are found co-spatial to the candidate relic, both candidate TRGs show possible counterparts; these are marked as red circles in the insets in Fig. 3.
To investigate the presence of a galaxy overdensity behind the Galactic plane, we employed the NIR (J, H, K band) source catalog of the UGS, only considering sources detected in all three bands that are reported to have a ≥95% probability of being a galaxy. We corrected the measurements for dust absorption following Schlafly & Finkbeiner (2011). We compared the galaxy density in two different regions centered on the X-ray peak: one circular “target” region with a radius of 3.5′, and a circular annulus “background” region with inner and outer radii of 5′ and 15′, respectively. We estimated the expected number of galaxies in the target region, λ, based on the target region area, At, multiplied by the galaxy density in the background region, λ = AtNbg/Abg, where Nbg and Abg are the galaxy count and area of the background region. The uncertainty of this estimate is  , following the Poisson statistics. This yields an expectation of λ = 106.7 ± 10.3 galaxies in the target region, while it contains 164 objects. This corresponds to a 5.1σ overdensity. Here, we neglected the uncertainty on the background estimate given its much larger area. In the cluster scenario, the overdensity should be strongest in early-type galaxies at a similar redshift and, thus, with similar red colors. To test this, we repeated the statistical calculation, this time only considering galaxies with a (J − K) color in the 2.2 ± 0.5 range. In this color interval, λ = 15.3 ± 3.9 galaxies are expected, while 67 are contained within the target region. The significance of the overdensity grows to 9.7σ. In Fig. 5, we display the UGS galaxies and their (J − K) color on top of the regions used in this analysis.
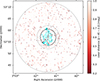 |
Fig. 5. UKIDSS GPS galaxies. The marker color corresponds to the difference in (J − K) color from a value of 2.2. The black circle marks the target and the dashed circular annulus the background region. In cyan, we show the X-ray contours. |
3. Discussion
In the following, we discuss our newly detected radio sources in the context of the possible interpretation of XMMU J034124.2+525720 as a galaxy cluster. We classify the northern “Arc” radio source as a candidate radio relic based on its steep spectrum, its elongated morphology, and its location and orientation with respect to the X-ray emission. The source is located in the direction of the major axis of the X-ray source, as expected for an ICM shock propagating along the merger axis. In this scenario, shock acceleration would take place at the northern edge of the emission, where the spectrum should be flatter (typically α ∼ −0.7), whereas the downstream region should be steeper due to spectral ageing (α < −1). The quality of the spectral index map shown in Fig. 4 is not sufficient to draw firm conclusions, but it is generally in agreement with such a scenario. In the interpretation as a radio relic, the bright area in the eastern part of the source would be a surface brightness fluctuation due, for example, to a spatial variation in the seed electron density or magnetic-field strength. We note that the interpretation as a radio relic requires the source to be unrelated to the nearby X-ray point source. We tentatively classify the low-surface-brightness diffuse emission co-spatial to the X-ray source as a radio halo due to its similar morphology to the X-ray source and the steep spectral index (α ∼ −1.4). Both radio relic and radio halo sources are commonly found in massive merging galaxy clusters (Cuciti et al. 2021). We further classify both the northern and southern tailed sources as candidate TRGs based on their morphology, steep spectral indices (α ≤ −0.9), and the superposition with bright red NIR galaxies. Their spectral index trend with flat (α ∼ −0.5) values toward the suggested host galaxy and steeper values along the tail is in agreement with this interpretation, as it resembles the characteristic spectral ageing of cosmic rays along tailed radio galaxies (Edler et al. 2022). TRGs are a tracer of overdense regions such as galaxy clusters.
In Sect. 2.1, we show that the X-ray spectrum can be fit as absorbed thermal ICM emission – this scenario is in fact slightly preferred to the nonthermal power-law fit. While the high extinction of the Galactic plane (E(B − V) = 1.7 mag) prevented us from identifying a possible cluster in the optical, the availability of the UGS data in the NIR, which is substantially less affected by extinction, allowed us to study the distribution of galaxies. Indeed, we found a highly significant excess of galaxies with red (J − K) colors. Given the combined evidence from the X-ray, radio, and NIR data, and the lack of clear evidence for a pulsar, we favor the interpretation of XMMU J034124.2+525720 as a massive merging galaxy cluster. Future observations in the hard X-ray regime will allow us to confirm the nature of XMMU J034124.2+525720, as at these energies, the power-law and thermal models strongly deviate.
Similarly, the classification as a galaxy cluster would be confirmed by the redshift. The best-fitting value of z ∼ 0.37 from our APEC model is not perfectly constrained. A determination of the redshift is possible via NIR spectroscopy of the red galaxies in the vicinity of the X-ray source. Alternatively, deep high-resolution X-ray spectroscopy would allow for the detection of ICM emission lines at a high signal-to-noise ratio. With the available data, estimates of the redshift can be obtained from the size of the radio sources and the brightness of the NIR galaxies. The vast majority of known relics have projected sizes ≥500 kpc (Jones et al. 2023), translating to a redshift z > 0.2. Assuming a typical size of the radio halo of 1 Mpc broadly suggests z ∼ 0.26. The K-band magnitude of the candidate brightest cluster galaxy (αJ2000 = 03h41m24s, δJ2000 = +52° 57′05″) is K = 14.2 mag. Assuming the galaxy’s absolute magnitude is within a scatter of ∼0.44 mag around MK = −26.12 (Lin & Mohr 2004), we obtained a rough redshift range of 0.23 ≤ z ≤ 0.36 after applying k-correction following Mannucci et al. (2001).
If the cluster scenario is correct and the X-ray source is not a PWN, the question of what object powers the UHE emission in its vicinity remains. In principle, UHE emission in clusters can originate from active galactic nuclei or from hadronic collisions of cosmic rays in the ICM. However, distant UHE sources are subject to strong absorption via e+e−-pair production with extragalactic photon fields. Furthermore, in their analysis of nearby galaxy clusters using LHAASO, Cao et al. (2025) did not detect even the nearest systems. Thus, 1LHAASO J0343+5254u is likely associated with a yet-to-be-discovered Galactic source. Bangale & Wang (2023) noted that the Fermi source 4FGL J0340.4+5302 (Abdollahi et al. 2020) is possibly associated with the UHE emission; De Sarkar & Majumdar (2024) further explored the possibility that a pulsar TeV halo could be responsible for the gamma-ray emission. Finally, Tsuji et al. (2025) identified several molecular clouds that could serve as proton–proton collision targets, producing hadronic gamma-rays via neutral pion decay. Future multiwavelength follow-up observations of this region may shed light on the origin of the UHE emission.
4. Conclusion
We suggest an alternative interpretation of the extended X-ray source XMMU J034124.2+525720 – initially reported by DK25 as a candidate PWN – as a galaxy cluster. We showed that a thermal plasma model with a redshift of z ≈ 0.37 provides an equal, and even slightly preferred, fit to the X-ray spectrum and that the X-ray source is co-spatial with a 9.7σ strong overdensity of red (J − K)∼2.2 NIR galaxies. We present novel LOFAR data and report the detection of sources that we classify as a (candidate) radio relic, radio halo, and TRGs. Given the lack of clear evidence for the existence of a pulsar and the compelling evidence for the cluster scenario, we prefer the interpretation of XMMU J034124.2+525720 as a previously unrecognized merging cluster. The interpretation of the X-ray source as a galaxy cluster means that the counterpart of 1LHAASO J0343+5254u remains unknown. Follow-up observations in the hard X-rays will be critical in order to obtain clarity on the classification of the X-ray emission, while NIR spectroscopy of the galaxies or deep high-resolution spectroscopy of the X-ray source will be necessary to confirm the cluster’s redshift.
Acknowledgments
The authors thank F. Gastadello for useful discussions. This paper uses data obtained with the LOFAR telescope (projects LT14_004 and LT16_004). LOFAR is the Low Frequency Array designed and constructed by ASTRON. It has observing, data processing, and data storage facilities in several countries, which are owned by various parties (each with their own funding sources), and that are collectively operated by the ILT foundation under a joint scientific policy. The ILT resources have benefited from the following recent major funding sources: CNRS-INSU, Observatoire de Paris and Université d’Orléans, France; BMBF, MIWF-NRW, MPG, Germany; Science Foundation Ireland (SFI), Department of Business, Enterprise and Innovation (DBEI), Ireland; NWO, The Netherlands; The Science and Technology Facilities Council, UK; Ministry of Science and Higher Education, Poland; The Istituto Nazionale di Astrofisica (INAF), Italy. This research made use of the Dutch national e-infrastructure with support of the SURF Cooperative (e-infra 180169) and the LOFAR e-infra group. The Jülich LOFAR Long Term Archive and the German LOFAR network are both coordinated and operated by the Jülich Supercomputing Centre (JSC), and computing resources on the supercomputer JUWELS at JSC were provided by the Gauss Centre for Supercomputing e.V. (grant CHTB00) through the John von Neumann Institute for Computing (NIC). This research made use of the University of Hertfordshire high-performance computing facility and the LOFAR-UK computing facility located at the University of Hertfordshire and supported by STFC [ST/P000096/1], and of the Italian LOFAR IT computing infrastructure supported and operated by INAF, and by the Physics Department of Turin university (under an agreement with Consorzio Interuniversitario per la Fisica Spaziale) at the C3S Supercomputing Centre, Italy.
References
- Abdollahi, S., Acero, F., Ackermann, M., et al. 2020, ApJS, 247, 33 [Google Scholar]
- Abeysekara, A. U., Albert, A., Alfaro, R., et al. 2019, ApJ, 881, 134 [NASA ADS] [CrossRef] [Google Scholar]
- Abeysekara, A. U., Albert, A., Alfaro, R., et al. 2021, Nat. Astron., 5, 465 [NASA ADS] [CrossRef] [Google Scholar]
- Aharonian, F., An, Q., Axikegu, et al. 2021, Chin. Phys. C, 45, 025002 [NASA ADS] [CrossRef] [Google Scholar]
- Bangale, P., & Wang, X. 2023, arXiv e-prints [arXiv:2308.15643] [Google Scholar]
- Bartalucci, I., Molendi, S., Rasia, E., et al. 2023, A&A, 674, A179 [NASA ADS] [CrossRef] [EDP Sciences] [Google Scholar]
- Cao, Z., Aharonian, F. A., An, Q., et al. 2021a, Nature, 594, 33 [NASA ADS] [CrossRef] [Google Scholar]
- Cao, Z., Aharonian, F., An, Q., et al. 2021b, ApJ, 917, L4 [NASA ADS] [CrossRef] [Google Scholar]
- Cao, Z., Aharonian, F., An, Q., et al. 2024, ApJS, 271, 25 [NASA ADS] [CrossRef] [Google Scholar]
- Cao, Z., Aharonian, F., Bai, Y. X., et al. 2025, ApJ, 982, L19 [Google Scholar]
- Cuciti, V., Cassano, R., Brunetti, G., et al. 2021, A&A, 647, A51 [EDP Sciences] [Google Scholar]
- de Gasperin, F., Edler, H. W., Williams, W. L., et al. 2023, A&A, 673, A165 [NASA ADS] [CrossRef] [EDP Sciences] [Google Scholar]
- De Sarkar, A., & Majumdar, P. 2024, A&A, 681, A34 [NASA ADS] [CrossRef] [EDP Sciences] [Google Scholar]
- DiKerby, S., Zhang, S., Ergin, T., et al. 2025, ApJ, 983, 21 [Google Scholar]
- Edler, H. W., de Gasperin, F., Brunetti, G., et al. 2022, A&A, 666, A3 [NASA ADS] [CrossRef] [EDP Sciences] [Google Scholar]
- Gaensler, B. M., & Slane, P. O. 2006, ARA&A, 44, 17 [Google Scholar]
- Halpern, J. P., & Gotthelf, E. V. 2019, ApJ, 882, 155 [Google Scholar]
- HI4PI Collaboration (Ben Bekhti, N., et al.) 2016, A&A, 594, A116 [NASA ADS] [CrossRef] [EDP Sciences] [Google Scholar]
- Hillas, A. M. 2005, J. Phys. G Nucl. Phys., 31, R95 [NASA ADS] [CrossRef] [Google Scholar]
- Jones, A., de Gasperin, F., Cuciti, V., et al. 2023, A&A, 680, A31 [NASA ADS] [CrossRef] [EDP Sciences] [Google Scholar]
- Katsuda, S., Tsunemi, H., Mori, K., et al. 2012, ApJ, 754, L7 [Google Scholar]
- Kollatschny, W., Meusinger, H., Hoeft, M., et al. 2021, A&A, 652, A24 [NASA ADS] [CrossRef] [EDP Sciences] [Google Scholar]
- Leccardi, A., & Molendi, S. 2008, A&A, 486, 359 [NASA ADS] [CrossRef] [EDP Sciences] [Google Scholar]
- Lin, Y.-T., & Mohr, J. J. 2004, ApJ, 617, 879 [Google Scholar]
- Linden, T., Auchettl, K., Bramante, J., et al. 2017, Phys. Rev. D, 96, 103016 [NASA ADS] [CrossRef] [Google Scholar]
- López-Coto, R., de Oña Wilhelmi, E., Aharonian, F., Amato, E., & Hinton, J. 2022, Nat. Astron., 6, 199 [CrossRef] [Google Scholar]
- Lucas, P. W., Hoare, M. G., Longmore, A., et al. 2008, MNRAS, 391, 136 [Google Scholar]
- Mannucci, F., Basile, F., Poggianti, B. M., et al. 2001, MNRAS, 326, 745 [Google Scholar]
- Molendi, S., Eckert, D., De Grandi, S., et al. 2016, A&A, 586, A32 [NASA ADS] [CrossRef] [EDP Sciences] [Google Scholar]
- Offringa, A. R., McKinley, B., Hurley-Walker, N., et al. 2014, MNRAS, 444, 606 [Google Scholar]
- Rossetti, M., Eckert, D., Gastaldello, F., et al. 2024, A&A, 686, A68 [NASA ADS] [CrossRef] [EDP Sciences] [Google Scholar]
- Schlafly, E. F., & Finkbeiner, D. P. 2011, ApJ, 737, 103 [Google Scholar]
- Shimwell, T. W., Hardcastle, M. J., Tasse, C., et al. 2026, A&A, 707, A198 [NASA ADS] [CrossRef] [EDP Sciences] [Google Scholar]
- Smith, R. K., Brickhouse, N. S., Liedahl, D. A., & Raymond, J. C. 2001, ApJ, 556, L91 [Google Scholar]
- Snowden, S. L., Mushotzky, R. F., Kuntz, K. D., & Davis, D. S. 2008, A&A, 478, 615 [NASA ADS] [CrossRef] [EDP Sciences] [Google Scholar]
- Tsuji, N., Takekawa, S., Mori, K., et al. 2025, ApJ, 983, 22 [Google Scholar]
- van Weeren, R. J., de Gasperin, F., Akamatsu, H., et al. 2019, Space Sci. Rev., 215, 16 [Google Scholar]
- van Weeren, R. J., Shimwell, T. W., Botteon, A., et al. 2021, A&A, 651, A115 [NASA ADS] [CrossRef] [EDP Sciences] [Google Scholar]
PeVatrons accelerate cosmic rays to energies beyond 1 PeV and are traced by UHE emission.
We followed the S ∝ να convention.
Appendix A: LOFAR data analysis
The coordinates of the X-ray source are covered by the pointings P053+54, P055+51 and P057+54 of the common LoTSS and LoLSS survey grid. In both cases, we carry out the source extraction and re-calibration procedure originally described in van Weeren et al. (2021). This means that from each pointing at both frequencies, we subtract all sources in the field of view from the visibilities except for a circular region of 24′ radius centered on the X-ray source. Then, we phase shift all observations to this center and correct the visibilities for the primary beam effect at the new phase center. Then, we carry out a self-calibration of the data. For the for LBA and HBA observations, we solve for a ‘tecandphase’ constraint on 16 s of time resolution. For the HBA data, we additionally solve for a ‘scalarcomplexgain’ constraint on 30 min time resolution. The final images are created with WSClean (Offringa et al. 2014) and corrected for the primary beam attenuation during imaging. The image noise level is σrms = 100 μJy beam−1 for the HBA and σrms = 2.1 mJy beam−1 for the LBA, at angular resolutions of 5″ × 8″ and 13″ × 19″, respectively.
From these, we create a spectral index map by re-gridding the images to the same pixel grid and convolving the HBA map to the synthesized beam shape of the LBA map. For all pixels above three times the root-mean-square (rms) noise, we calculated the spectral index according to
 (A.1)
(A.1)
The spectral index map is shown in Fig. 4 and the corresponding uncertainty map is shown in Fig. A.1.
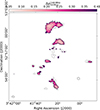 |
Fig. A.1. LOFAR spectral index uncertainty map at a resolution of 19.7″ × 12.6″. |
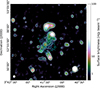 |
Fig. A.2. Compact-source subtracted radio map at 144 MHz, the noise level is σrms = 299 μJy beam−1 at 33″ × 35″ resolution. The contours start at 3σrms and increase in powers of two. In cyan, we show the 0.5 − 7 keV X-ray contours, starting at 5 × 10⁻⁶ cts s−1 arcsec−2 and increasing in factors of two. |
Appendix B: X-ray re-analysis
 |
Fig. B.1. Observed source spectrum (black=MOS1, red=MOS2, green=pn) with power-law best-fit model reported. The spectra of the three cameras and three observations were jointly fitted, but the results of a single ObsID (0923400401) were reported for clarity. For energy ranges 1.2-1.9 keV (for the MOS detectors) and 1.2-1.7 keV and 7-9.2 keV (for the pn detector) were excluded during the fit. Each spectral bin was re-binned to a minimum significance of 5σ for visualization purposes. |
All Tables
All Figures
|
Fig. 1. Observed source spectrum (black = MOS1; red = MOS2; green = pn) with APEC best-fit model reported. The spectra of the different cameras and observations were fit jointly, but the results of a single ObsID (0923400401) were reported for clarity. For energy ranges 1.2−1.9 keV (for the MOS detectors) and 1.2−1.7 keV and 7−9.2 keV (for the pn detector) were excluded during the fit. Each spectral bin was re-binned to a minimum significance of 5σ for visualization purposes. Residuals in the pn spectrum at 2.1 keV are instrumental (Au lines; Leccardi & Molendi 2008). |
| In the text | |
|
Fig. 2. LoTSS DR3 map of the wider area surrounding the LHAASO sources in Galactic coordinates. The central frequency is 144 MHz and the noise level is σrms = 100 μJy beam−1 at a resolution of 6″. The green circles show the 39% containment radius of the LHAASO sources, and the red contours mark the 0.5 − 7 keV emission around XMMU J034124.2+525720 smoothed to 20″ resolution, starting at 5 × 10⁻⁶ cts s−1 arcsec−2 and increasing in factors of two. |
| In the text | |
|
Fig. 3. Radio map at 144 MHz; the noise level is σrms = 100 μJy beam−1 at 5″ × 8″ resolution. In cyan we show the 0.5 − 7 keV X-ray contours. The insets show the NIR image with the radio contours of the tailed sources overlaid; red circles mark UGS galaxies. |
| In the text | |
|
Fig. 4. Radio spectral index map at a resolution of 20″ × 13″. Gray contours correspond to 1 Jy beam−1 × [1, 2, 4, 8] in the 144 MHz map at the same resolution; black crosses mark the location of candidate IR host galaxies. |
| In the text | |
|
Fig. 5. UKIDSS GPS galaxies. The marker color corresponds to the difference in (J − K) color from a value of 2.2. The black circle marks the target and the dashed circular annulus the background region. In cyan, we show the X-ray contours. |
| In the text | |
|
Fig. A.1. LOFAR spectral index uncertainty map at a resolution of 19.7″ × 12.6″. |
| In the text | |
|
Fig. A.2. Compact-source subtracted radio map at 144 MHz, the noise level is σrms = 299 μJy beam−1 at 33″ × 35″ resolution. The contours start at 3σrms and increase in powers of two. In cyan, we show the 0.5 − 7 keV X-ray contours, starting at 5 × 10⁻⁶ cts s−1 arcsec−2 and increasing in factors of two. |
| In the text | |
|
Fig. B.1. Observed source spectrum (black=MOS1, red=MOS2, green=pn) with power-law best-fit model reported. The spectra of the three cameras and three observations were jointly fitted, but the results of a single ObsID (0923400401) were reported for clarity. For energy ranges 1.2-1.9 keV (for the MOS detectors) and 1.2-1.7 keV and 7-9.2 keV (for the pn detector) were excluded during the fit. Each spectral bin was re-binned to a minimum significance of 5σ for visualization purposes. |
| In the text | |
Current usage metrics show cumulative count of Article Views (full-text article views including HTML views, PDF and ePub downloads, according to the available data) and Abstracts Views on Vision4Press platform.
Data correspond to usage on the plateform after 2015. The current usage metrics is available 48-96 hours after online publication and is updated daily on week days.
Initial download of the metrics may take a while.