Fig. 1.
Download original image
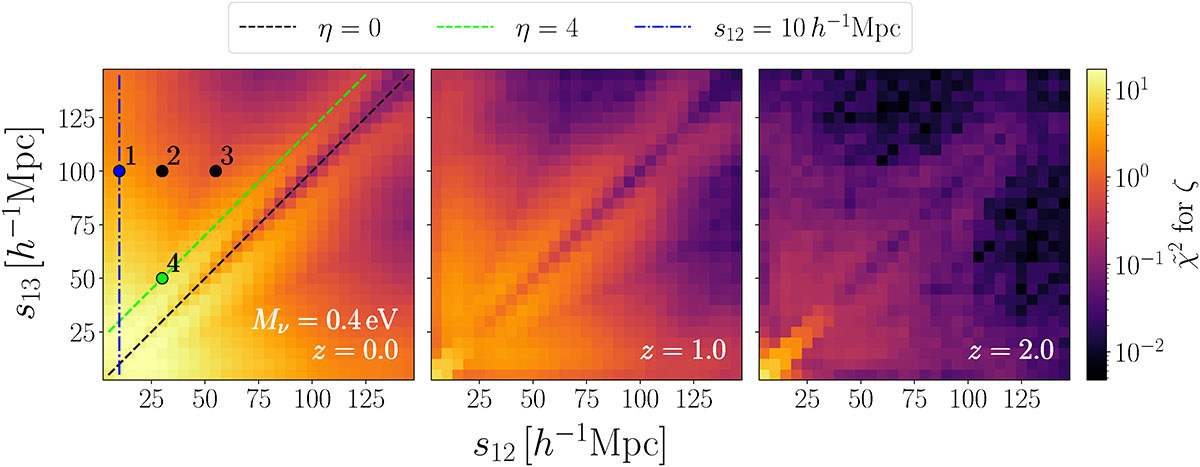
Values of the parameter ![]() defined in Eq. (11) for the single-scale connected 3PCF obtained for Mν = 0.4 eV. Each panel corresponds to a different redshift. From left to right, z = 0, 1, and 2. The lines overplotted on the left panel are taken as representative of regions with a stronger signal, and they identify isosceles triangles (dashed black line with η = 0, where the signal is only enhanced on scales ≲30 h−1 Mpc), quasi-isosceles triangles with η = 4 (dashed green line), and triangles with s12 = 10 h−1 Mpc (dash-dotted blue line). The numbered circles on the lines identify some (s12, s13) configurations that correspond in increasing order from 1 to 4 to (10,100), (30,100), (55,100), and (30,50) h−1 Mpc. For them, we plot the single-scale ζ in Fig. 2.
defined in Eq. (11) for the single-scale connected 3PCF obtained for Mν = 0.4 eV. Each panel corresponds to a different redshift. From left to right, z = 0, 1, and 2. The lines overplotted on the left panel are taken as representative of regions with a stronger signal, and they identify isosceles triangles (dashed black line with η = 0, where the signal is only enhanced on scales ≲30 h−1 Mpc), quasi-isosceles triangles with η = 4 (dashed green line), and triangles with s12 = 10 h−1 Mpc (dash-dotted blue line). The numbered circles on the lines identify some (s12, s13) configurations that correspond in increasing order from 1 to 4 to (10,100), (30,100), (55,100), and (30,50) h−1 Mpc. For them, we plot the single-scale ζ in Fig. 2.
Current usage metrics show cumulative count of Article Views (full-text article views including HTML views, PDF and ePub downloads, according to the available data) and Abstracts Views on Vision4Press platform.
Data correspond to usage on the plateform after 2015. The current usage metrics is available 48-96 hours after online publication and is updated daily on week days.
Initial download of the metrics may take a while.