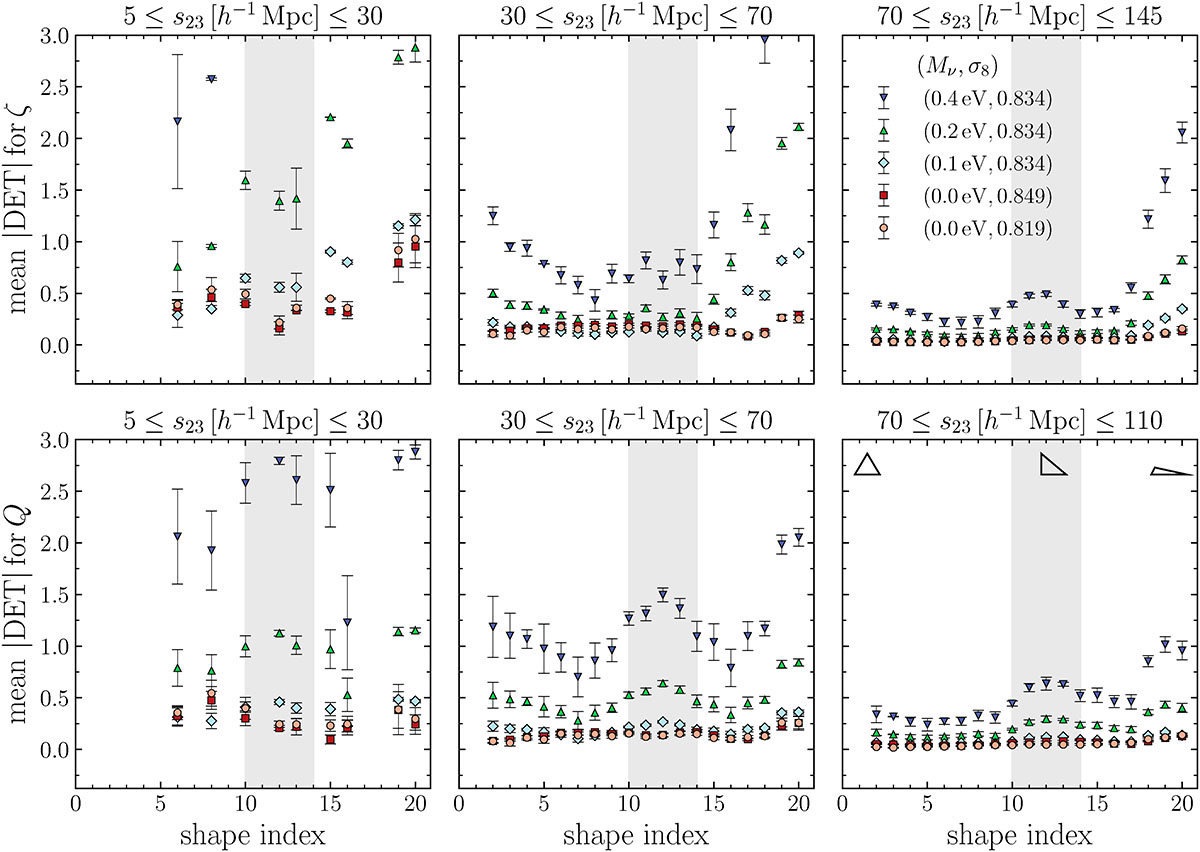
Fig. D.2.
Download original image
Mean of the absolute detectabilities (markers) as a function of the shape index (defined in Fig. D.1) at z = 0, for the simulations with massive neutrinos and variable σ8, and its corresponding standard error (error bars). The results for the connected and reduced 3PCF ζ and Q are shown in the top and bottom rows, respectively. Each column corresponds to a different range of triangle scales, depending on the value of the largest triangle side s23, as detailed in the label above each panel: small (5 h−1 Mpc ≤ s23 ≤ 30 h−1 Mpc), intermediate (30 h−1 Mpc ≤ s23 ≤ 70 h−1 Mpc), and large (70 h−1 Mpc ≤ s23 ≤ 145 h−1 Mpc for ζ and 70 h−1 Mpc ≤ s23 ≤ 110 h−1 Mpc for Q). The means are computed only for those shape indices that correspond to at least two populated (s12/s23, s13/s23) bins, depending on the considered scale range and the adopted binning of the side ratios. The schematic representation of triangles in the bottom-right panel qualitatively shows the mapping between the shape index and triangle shapes: low values correspond to equilateral and quasi-equilateral triangles, intermediate values (highlighted by the vertical gray band) to right-angled and quasi-right-angled triangles, and large values to elongated (squeezed/folded) triangles. The vertical axis shows only the mean detectability values below 3, to better highlight the differences between the lowest neutrino mass, Mν = 0.1 eV, and the varying-σ8 simulations.
Current usage metrics show cumulative count of Article Views (full-text article views including HTML views, PDF and ePub downloads, according to the available data) and Abstracts Views on Vision4Press platform.
Data correspond to usage on the plateform after 2015. The current usage metrics is available 48-96 hours after online publication and is updated daily on week days.
Initial download of the metrics may take a while.