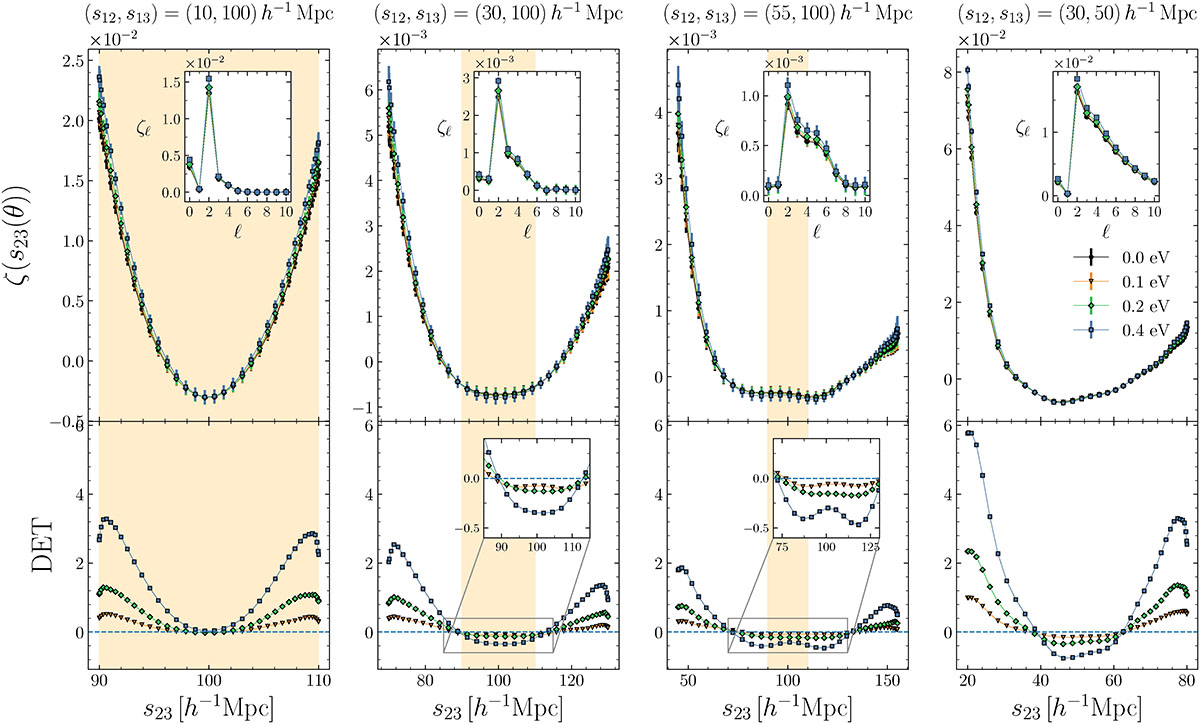
Fig. 2.
Download original image
Single-scale connected 3PCF for the triangle configurations selected in Fig. 1 (upper plots of each panel), as indicated in the top label. We show the results at z = 0, with a different color for each neutrino mass, as indicated in the legend. The inset plots in the upper row show the multipoles ζℓ(s12, s13) from which the 3PCF was reconstructed. The lower plots show the corresponding detectabilities as a function of s23 (Eq. 10). The dashed blue line marks the zero detectability level. The orange shaded areas show the region 90 h−1 Mpc ≤ s23 ≤ 110 h−1 Mpc, corresponding to the expected location of the BAO peak. Where the BAO scales do not cover the full s23 range, we include a zoom-in on the detectability in that region to better visualize the effect of neutrinos in those ranges.
Current usage metrics show cumulative count of Article Views (full-text article views including HTML views, PDF and ePub downloads, according to the available data) and Abstracts Views on Vision4Press platform.
Data correspond to usage on the plateform after 2015. The current usage metrics is available 48-96 hours after online publication and is updated daily on week days.
Initial download of the metrics may take a while.