Fig. 3.
Download original image
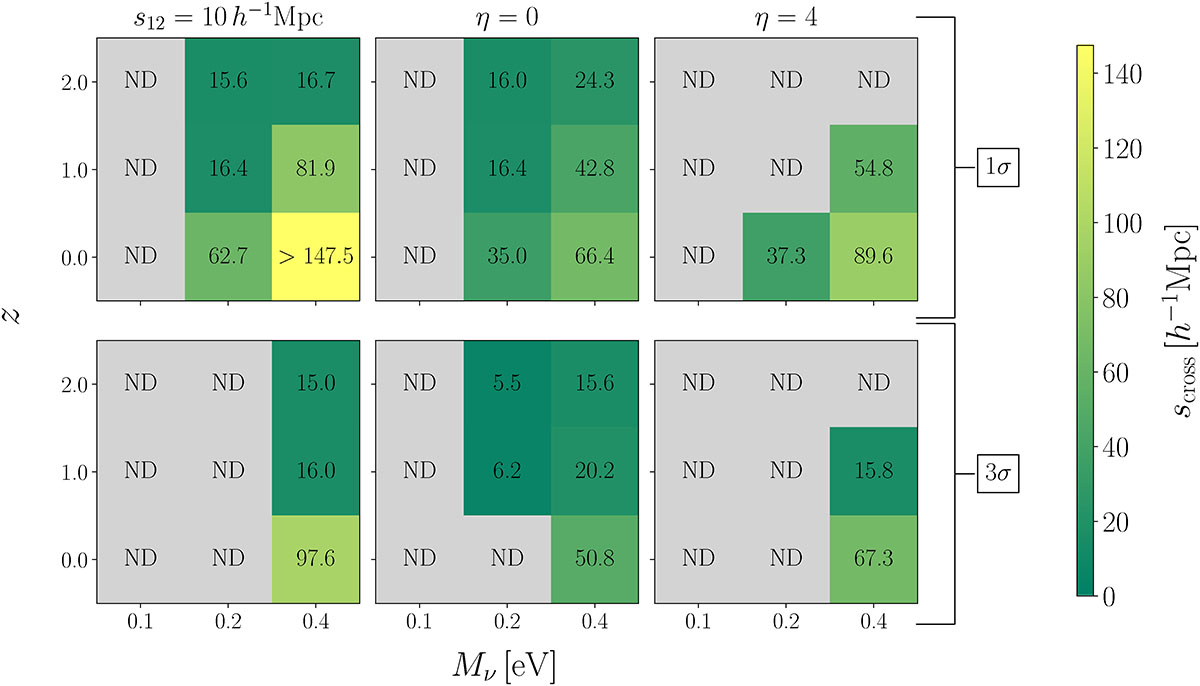
Detectability matrices of massive neutrinos. Each matrix element shows the scale scross (Eq. 14) below which, considering all triangles with a scale larger than scross, we obtained a significant detection of the signal from massive neutrinos in the connected 3PCF. The matrices in the upper and lower rows show the values for a 1σ and 3σ statistical significance (Eq. 13), respectively, computed for a volume of 10 h−3 Gpc3. In each matrix, Mν increases from left to right, and redshifts increase from bottom to top. We show the results for the three configurations corresponding to the lines in Fig. 1, i.e., from left to right: triangles with s12 = 10 h−1 Mpc, isosceles triangles (η = 0), and quasi-isosceles triangles with η = 4. The quantity scross represents one of the two sides, s12 or s13, depending on the configuration: in particular, in Eq. (14) we set s = s13 for triangles with fixed s12, and s = s12 for isosceles and η = 4 triangles. Brighter colors represent better detection levels, i.e., occurring at larger scales. The label ND stands for “not detectable” above the specified significance threshold at any scale. A lower limit is indicated whenever the signal is detectable above a given threshold of statistical significance over the entire range of scales considered in our analysis.
Current usage metrics show cumulative count of Article Views (full-text article views including HTML views, PDF and ePub downloads, according to the available data) and Abstracts Views on Vision4Press platform.
Data correspond to usage on the plateform after 2015. The current usage metrics is available 48-96 hours after online publication and is updated daily on week days.
Initial download of the metrics may take a while.