Fig. 4.
Download original image
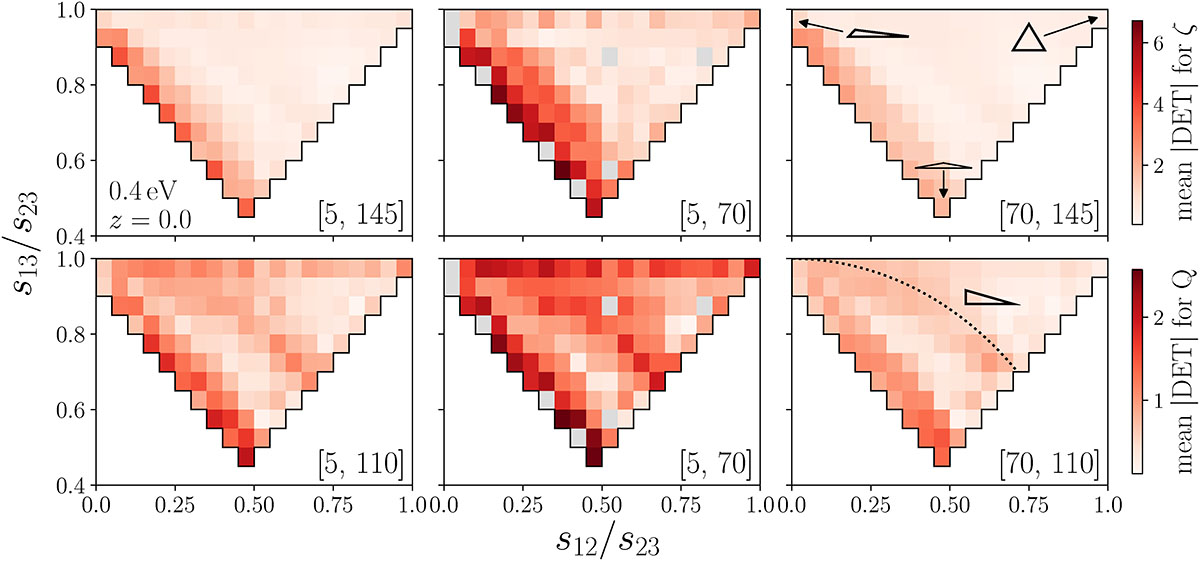
Detectability of the halo connected 3PCF (upper panels) and reduced 3PCF (lower panels) as a function of the triangle shape. The results are reported at z = 0 and for Mν = 0.4 eV. The triangle shapes are determined by the side ratios s12/s23 and s13/s23, with s12 ≤ s13 ≤ s23. In each panel, each pixel represents a given triangle shape, where the color shows the absolute value of the detectability averaged over all the triangles available in the all-scales approach with that shape and different sizes. As shown in the legend in the upper right panel, the bottom center, upper right, and upper left parts of the plot contain folded, equilateral, and squeezed triangles, respectively. The dotted curve in the lower right panel marks the location of right-angled triangles. The white region corresponds to the area in the parameter space where it is not possible to obtain a closed triangle. The various columns differ by the range of s23 considered, specified in the intervals shown in the bottom right corner (in units of h−1 Mpc). Empty bins are colored in gray.
Current usage metrics show cumulative count of Article Views (full-text article views including HTML views, PDF and ePub downloads, according to the available data) and Abstracts Views on Vision4Press platform.
Data correspond to usage on the plateform after 2015. The current usage metrics is available 48-96 hours after online publication and is updated daily on week days.
Initial download of the metrics may take a while.