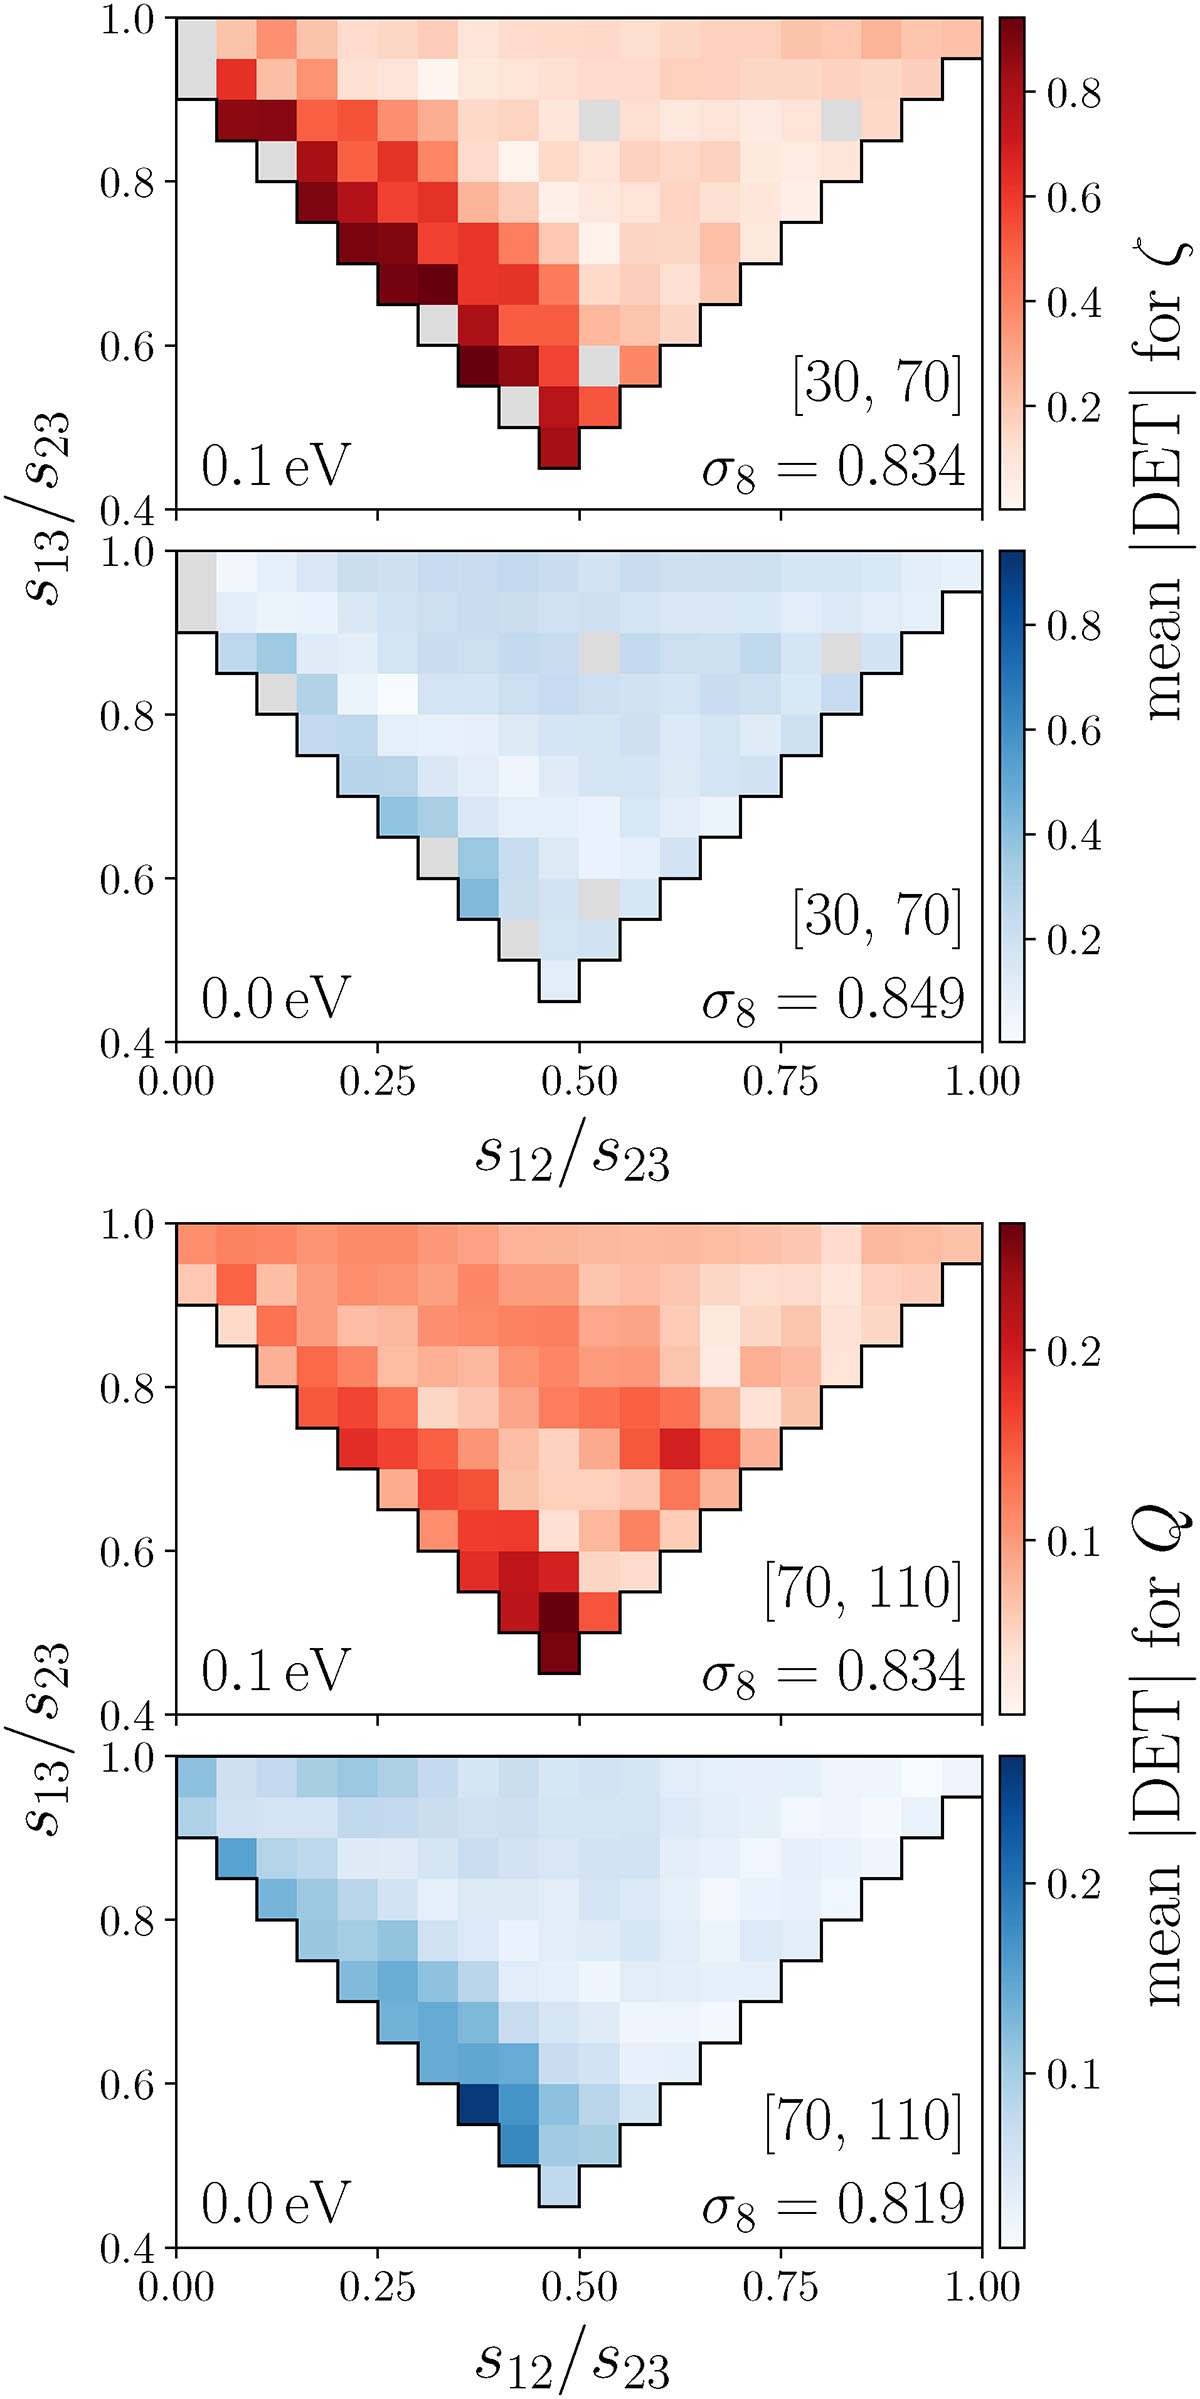
Fig. 5.
Download original image
Comparison between the detectability of a variation in Mν and σ8 from the halo 3PCF as a function of triangle shape. We show the results for the simulations at z = 0 with Mν = 0.1 eV and fiducial σ8 = 0.834 (red scale color maps), and with Mν = 0 eV and σ8 = 0.849 (upper blue scale color map) and σ8 = 0.819 (lower blue scale color map). The top and bottom pairs of plots refer to the connected and reduced 3PCF, respectively. Triangle shapes are identified by the side ratios s12/s23 and s13/s23, with s12 ≤ s13 ≤ s23, as shown in Fig. 4. In each plot, a given shape bin shows the absolute value of the detectability, averaged over all triangles available in the all-scales approach with that shape and different sizes. We present the results obtained by considering triangles on scales 30 h−1 Mpc < s23 < 70 h−1 Mpc for ζ, and 70 h−1 Mpc < s23 < 110 h−1 Mpc for Q.
Current usage metrics show cumulative count of Article Views (full-text article views including HTML views, PDF and ePub downloads, according to the available data) and Abstracts Views on Vision4Press platform.
Data correspond to usage on the plateform after 2015. The current usage metrics is available 48-96 hours after online publication and is updated daily on week days.
Initial download of the metrics may take a while.