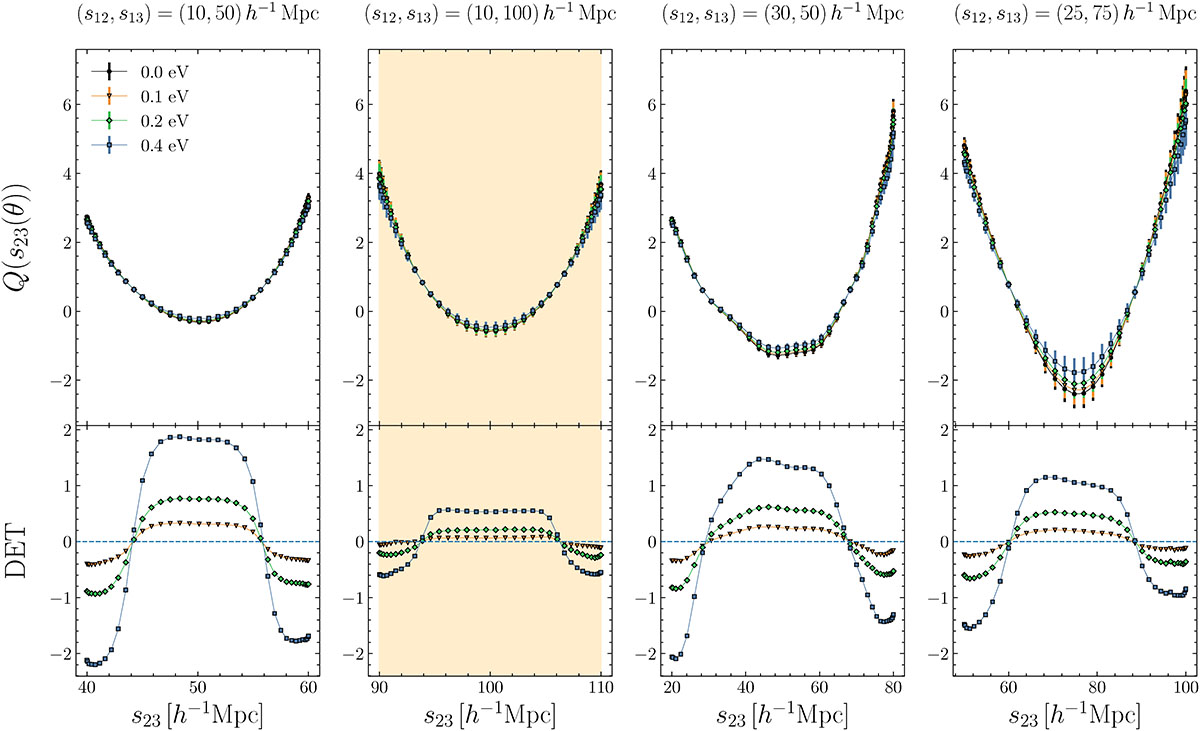
Fig. B.2.
Download original image
Single-scale reduced 3PCF Q (upper plot of each panel) for the (s12, s13) configurations selected in Fig. B.1 and indicated at the top, as a function of the third side s23. We show here the results for z = 0, with a different color for each of the considered neutrino masses, as shown in the legend. The lower plots show the corresponding detectabilities as a function of s23 (Eq. 10), with the same color coding as Q. A blue dashed line marks the zero detectability level. The orange shaded area shows the region 90 h−1 Mpc ≤ s23 ≤ 110 h−1 Mpc, corresponding to the expected location of the BAO peak.
Current usage metrics show cumulative count of Article Views (full-text article views including HTML views, PDF and ePub downloads, according to the available data) and Abstracts Views on Vision4Press platform.
Data correspond to usage on the plateform after 2015. The current usage metrics is available 48-96 hours after online publication and is updated daily on week days.
Initial download of the metrics may take a while.