Fig. D.1
Download original image
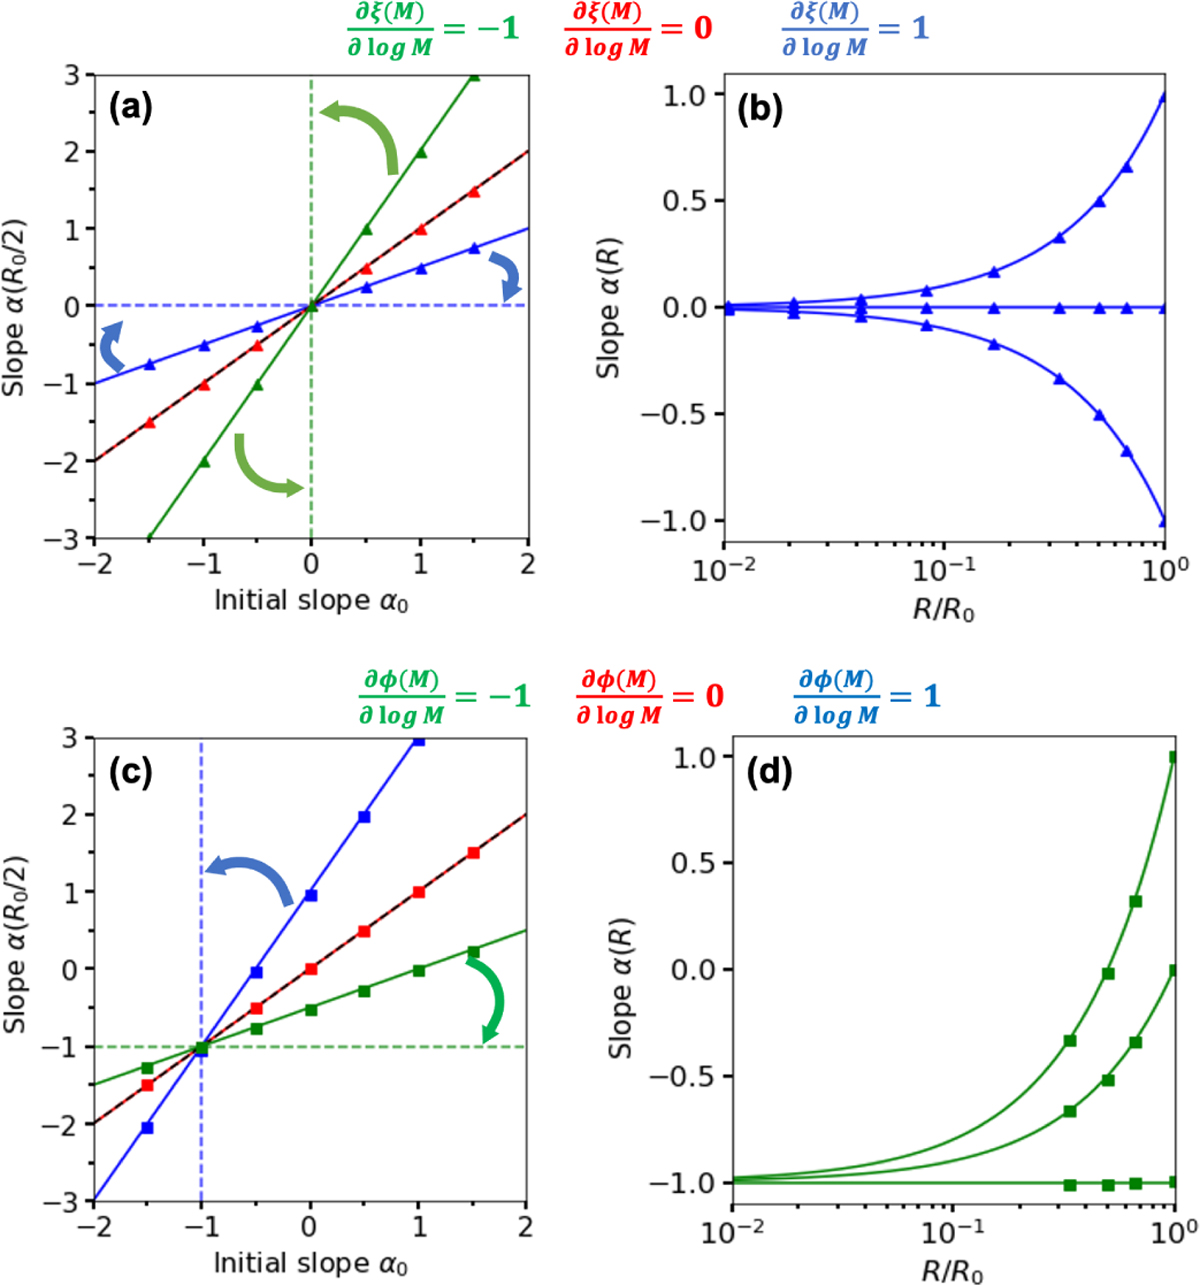
Evolution of the local power-law index (Γ) of a mass distribution. The influence of the mass transfer rate (ξ) and the fragmentation rate (ϕ) dependences with the mass M of the parental fragment is shown in (a), (b) and (c), (d) respectively. The solid lines, triangles and squares represent respectively the theoretical solutions from Eq. D.3, the Monte Carlo solutions obtained from a sample of 106 objects distributed in a power law of index Γ0 fragmenting according to Eq. D.8 and Eq. D.12. (a)-(c): Local power-law index (Γ) as a function of the initial slope Γ0 at scale R0/2. Dashed green and blue lines indicate the asymptotic limits of Γ(R). (b)-(d): Local power-law index (Γ) as a function of the spatial scale R for different initial slopes. The Monte Carlo solutions do not go below R/R0 ≈ 0.3 because the number of fragment constituting the fCMF becomes too large to compute.
Current usage metrics show cumulative count of Article Views (full-text article views including HTML views, PDF and ePub downloads, according to the available data) and Abstracts Views on Vision4Press platform.
Data correspond to usage on the plateform after 2015. The current usage metrics is available 48-96 hours after online publication and is updated daily on week days.
Initial download of the metrics may take a while.