Fig. 9
Download original image
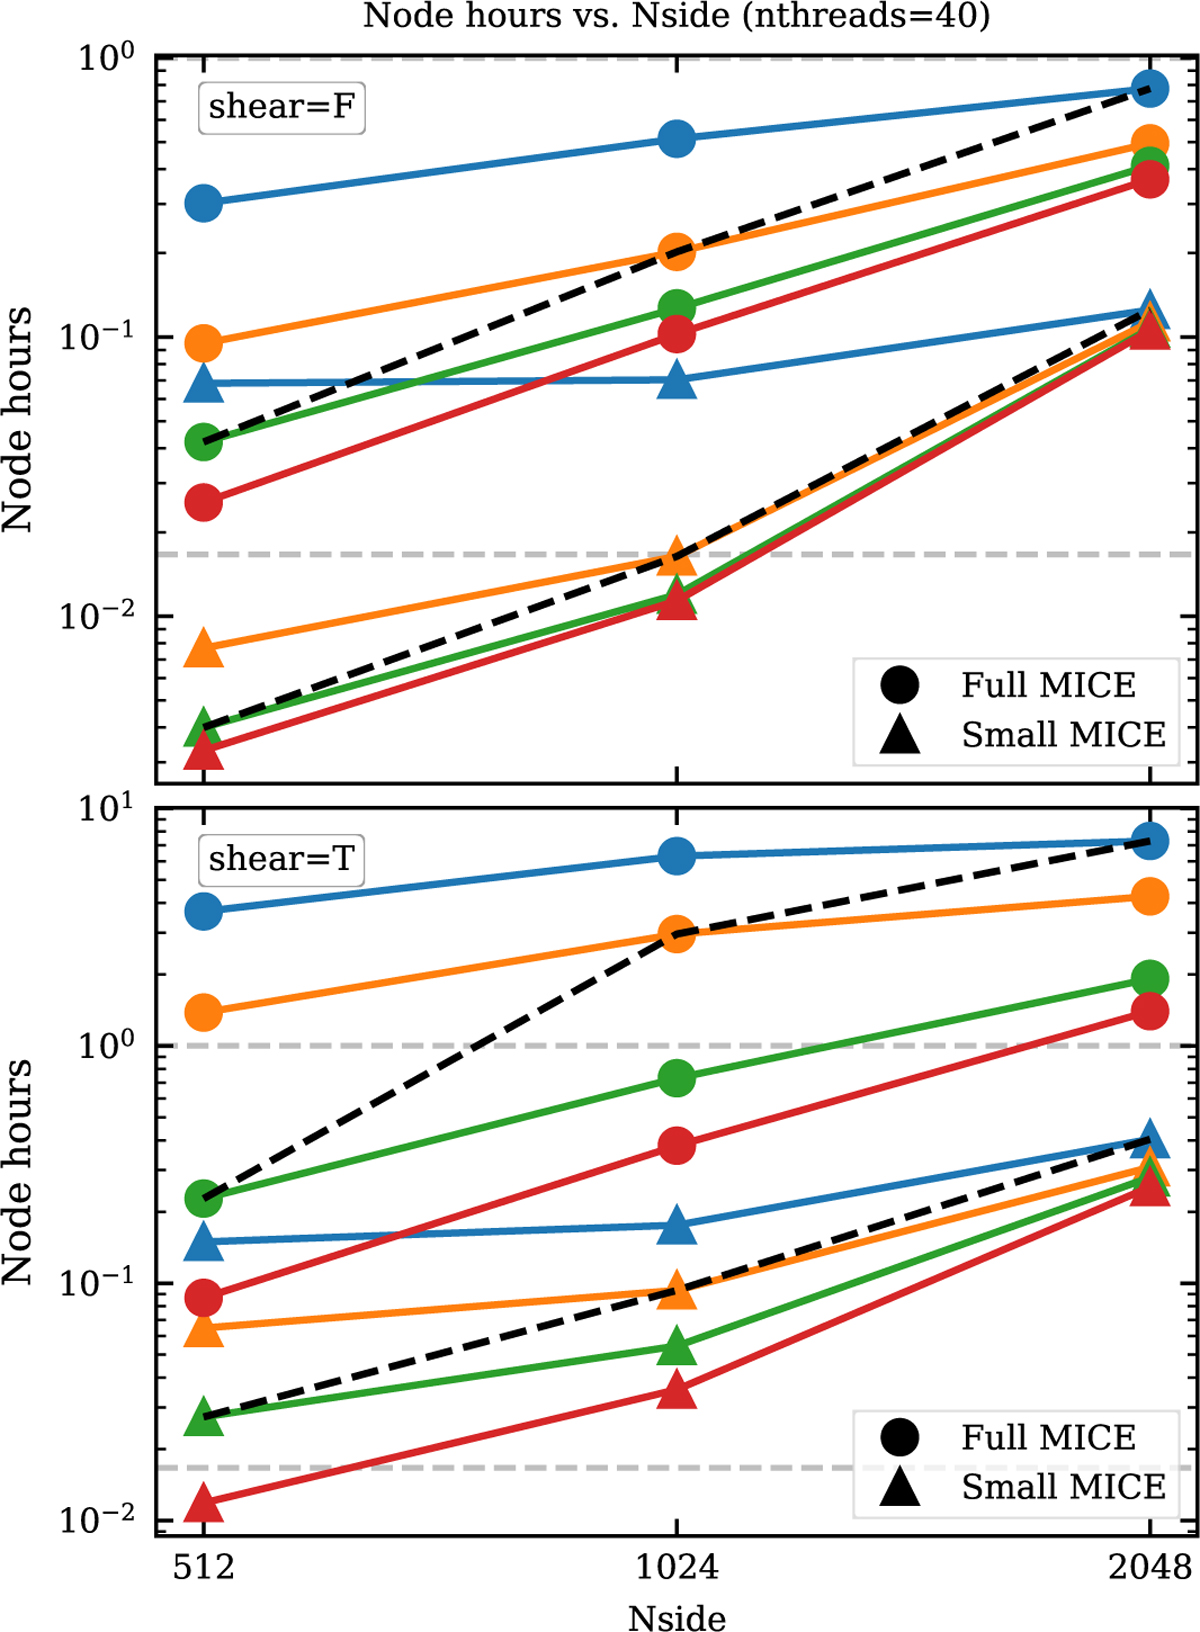
CPU cost of RCF computation. We show the CPU cost as a function of pixel resolution Nside, with different redshift resolutions zΔ for clustering (top) or for clustering and shear (bottom). The redshift resolution is, from top down, zΔ=0.0005 (blue), zΔ=0.001 (yellow), zΔ=0.0025 (green), and zΔ=0.005 (red). The dashed lines connect points where Nside and zΔ correspond to the same spatial resolution (from left to right, 6 Mpc, 3 Mpc, 1.5 Mpc). The input data is the full (circles) or the small (triangles) MICE simulation in z = 1.0–1.2. To guide the eye, one node-hour and one node-minute have been indicated by horizontal lines.
Current usage metrics show cumulative count of Article Views (full-text article views including HTML views, PDF and ePub downloads, according to the available data) and Abstracts Views on Vision4Press platform.
Data correspond to usage on the plateform after 2015. The current usage metrics is available 48-96 hours after online publication and is updated daily on week days.
Initial download of the metrics may take a while.