Fig. 6
Download original image
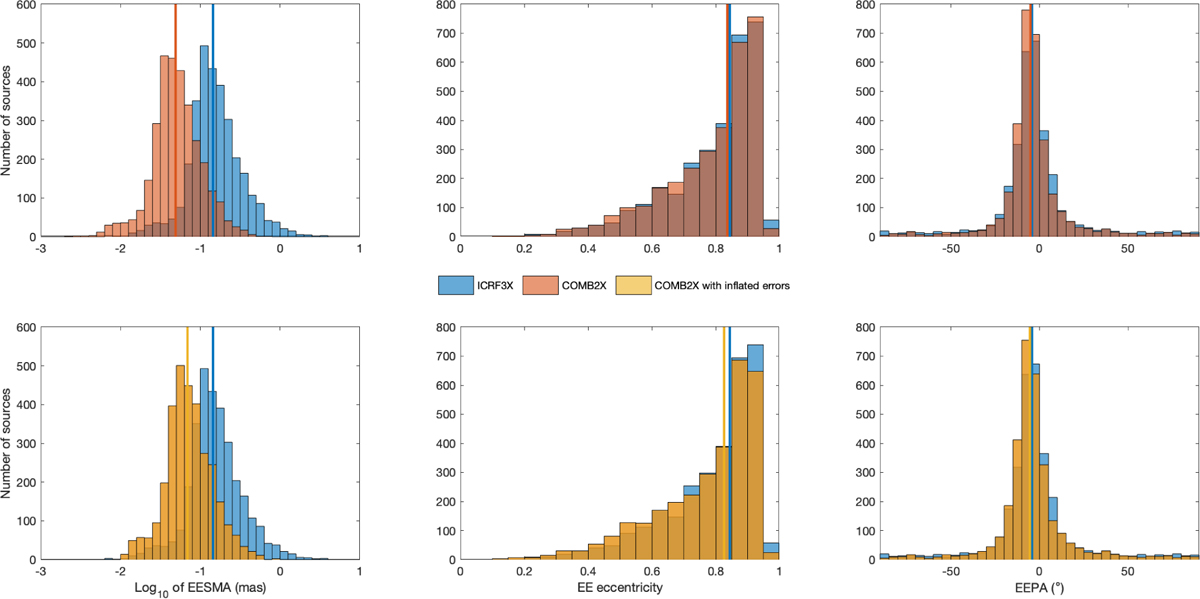
Top row: comparison of the distribution of error ellipse semimajor axis (EESMA), eccentricities, and semimajor axis position angle (EEPA) for common sources of COMB2X and ICRF3X. The vertical lines indicate the median value of each distribution. The ICRF3X EESMA is computed with the deflated errors. Bottom row: same, but for COMB2X with inflated errors (see Sect. 3.5).
Current usage metrics show cumulative count of Article Views (full-text article views including HTML views, PDF and ePub downloads, according to the available data) and Abstracts Views on Vision4Press platform.
Data correspond to usage on the plateform after 2015. The current usage metrics is available 48-96 hours after online publication and is updated daily on week days.
Initial download of the metrics may take a while.