| Issue |
A&A
Volume 709, May 2026
|
|
|---|---|---|
| Article Number | A98 | |
| Number of page(s) | 11 | |
| Section | Celestial mechanics and astrometry | |
| DOI | https://doi.org/10.1051/0004-6361/202556388 | |
| Published online | 07 May 2026 | |
A VLBI-based combined catalog of radio source positions
1
LTE, Observatoire de Paris, Université PSL, CNRS UMR8255, Sorbonne Université, Université de Lille,
61 avenue de l’Observatoire,
75014
Paris,
France
2
Pulkovo Observatory,
Pulkovskoe Sh. 65,
St. Petersburg
196140,
Russia
★ Corresponding authors: This email address is being protected from spambots. You need JavaScript enabled to view it.
; This email address is being protected from spambots. You need JavaScript enabled to view it.
Received:
13
July
2025
Accepted:
22
March
2026
Abstract
Context. The International Celestial Reference System is realized in the radio band by a catalog of radio source positions obtained by very long baseline interferometry (VLBI) measurements and is called the International Celestial Reference Frame (ICRF). The current ICRF approved by the International Astronomical Union at its 30th general assembly in August 2018 is the ICRF3. Discussions are currently underway on the preparation of the next ICRF release, the ICRF4.
Aims. For this paper, we investigated a possibility to improve the S/X version of the ICRF3 by constructing a combined catalog of radio source positions based on individual catalogs provided by VLBI analysis centers.
Methods. This study is based on the analysis of the systematic errors of the six most recent VLBI radio source catalogs using vector spherical harmonics. In the first step, we determined the systematic differences between each input catalog and the S/X version of the ICRF3. These systematics were then applied to the input catalogs to transform them into the ICRF3 system. The average of these transformed catalogs is the combined catalog in the ICRF3 system (COMB1X). Applying the averaged systematics to the COMB1X catalog, we obtained the combined catalog in an independent system (COMB2X). The intercomparison of partial combinations allowed us to rescale the formal errors to make them more realistic.
Results. The two combined catalogs of radio source positions contain a few more sources than the individual catalogs. The COMB1X catalog can be considered an improvement on ICRF3 in terms of stochastic errors. The COMB2X catalog can be considered an improvement on ICRF3 in terms of both stochastic and systematic errors. The COMB2X catalog reveals systematic errors of a few tens of microarcseconds with respect to the ICRF3.
Key words: techniques: interferometric / astrometry / reference systems / quasars: general
© The Authors 2026
 Open Access article, published by EDP Sciences, under the terms of the Creative Commons Attribution License (https://creativecommons.org/licenses/by/4.0), which permits unrestricted use, distribution, and reproduction in any medium, provided the original work is properly cited.
This article is published in open access under the Subscribe to Open model. This email address is being protected from spambots. You need JavaScript enabled to view it. to support open access publication.
1 Introduction
Establishing a fundamental coordinate system on the sky is a key problem of astrometry. Until 1997, the celestial coordinate system was realized by fundamental catalogs of star positions. In 1997, the International Astronomical Union (IAU) adopted Resolution B2, which established that from 1 January 1998 the IAU celestial reference system would be the International Celestial Reference System (ICRS; Arias et al. 1995; Feissel & Mignard 1998), and that the corresponding fundamental reference frame would be the International Celestial Reference Frame (ICRF) based on the positions of extragalactic radio sources derived from very long baseline interferometry (VLBI)1. The first ICRF catalog consisted of 608 sources (Ma et al. 1998) followed by the ICRF2 (Fey et al. 2015), which contained the positions of 3414 sources, and the ICRF3 (Charlot et al. 2020), which included 4588 sources, of which 4536 observed at S/X band. All three ICRF releases were created by a single inversion of ionosphere-free VLBI delays recorded between 1979 and few months before the release date. The analysis was done by one VLBI analysis center after extensive discussions within the working groups about the analysis configuration, the data, and the various models forming the VLBI delay.
Before the advent of the space astrometry missions HIPPARCOS (Perryman 1997) and Gaia (Prusti et al. 2016), the most accurate star-based realizations of the fundamental celestial reference frame (CRF) such as the Fourth and Fifth Fundamental Catalogues (FK4) (Fricke et al. 1963) and FK5 (Fricke et al. 1988) were constructed as a combination of individual catalogs computed by different scientific groups. The combination of several catalogs allows one to mitigate their random and spatially correlated large-scale errors (also called systematic errors; see, e.g., Makarov et al. 2012), and to improve the completeness of the sample.
Similar studies were conducted to investigate the possibility of using a combination procedure for VLBI-based radio source position catalogs at a single frequency (Sokolova & Malkin 2007, 2014) or across several frequencies (Karbon & Nothnagel 2019). Such combinations were strongly motivated by the fact that, at the sought after microarcsecond (μas) level of precision and accuracy, the choices made by individual analysis centers in their analysis configuration lead to tens of μas differences between catalogs in terms of random and systematic errors, thus creating individual catalogs expressed in their own reference frames. The intercomparison of individual catalogs allows one to separate random and systematic errors, and thus provides all source positions expressed in a common reference frame, which in turn is the best materialization of the ICRS.
Other works considered providing a wavelength-independent reference frame from catalogs made at different radio frequencies (Karbon & Nothnagel 2019) or at radio and optical frequencies (Makarov et al. 2023). In such catalogs, random position errors also come from intrinsic properties of the sources (opacity of the base of the relativistic jet that makes the prominent radio emission point frequency dependent; see, e.g., Porcas 2009).
The main purpose of this work is to further develop the combination technique for combining the CRF solutions obtained in the analysis centers of the International VLBI Service for Geodesy and Astrometry (IVS; Nothnagel et al. 2017) at S/X band, i.e., relevant to positions at 8.4 GHz. Although the computation procedures used in this study are similar to those used by Sokolova & Malkin (2007, 2014), several substantial developments have been implemented, such as the use of vector spherical harmonics (VSH) for the analysis of systematic differences between catalogs, refined procedures for data editing and weighting, as well as some minor improvements. Finally, the aim of this work is to promote further discussion of the optimal strategy for constructing the next ICRF release (ICRF4; Charlot 2025).
The catalogs used in this study.
2 Input catalogs
The input data used in this work consist of radio source position catalogs obtained from processing the VLBI observational data at S/X bands by the individual IVS analysis centers. They are made publicly available on the IVS data center2 or through the analysis centers’ web site3. We retained the six most recent solutions from the following analysis centers: Agenzia Spaziale Italiana (ASI, Italy), Geoscience Australia (AUS, Australia), Bundesamt für Kartographie und Geodäsie (BKG, Germany), Paris observatory (OPA, France), the United States Naval Observatory (USN, USA), and Technischen Universität Wien (VIE, Austria). All these catalogs are expected to be of comparable quality because they all result from the processing of a major part of the complete existing VLBI observational data and because they were obtained using a standard analysis configuration close to the one used for the generation of the ICRF3 catalog. As a reference catalog, representing the current best materialization of the ICRS, we used the ICRF3 S/X, referred to as ICRF3X in the following. The set of catalogs is presented succinctly in Table 1, where we mention the number of sources, the time span of the observations, the resulting number of delays used in the analysis, and the median angular separation between the catalog and the ICRF3X for the sources in common to all catalogs.
At first glance the values in Table 1 already inform on the substantial differences between the input catalogs. The catalogs submitted to the IVS are based on modeling the VLBI delay following state-of-the-art models that comply with the IERS Conventions (see Petit & Luzum 2010, and updates). However, for analyzing the delays and fitting the geodetic and astrometric parameters of interest, the analysis centers can apply some variants, including choice of the analysis software package; exclusion of some sessions considered inappropriate for determining geodetic parameters; modeling of the rapidly variable station-dependent clock and troposphere parameters using step, piecewise linear, or quadratic functions; choice of the subnetwork on which the minimal constraints are applied to the position and/or velocities; subset of sources on which the minimal constraints are applied; choice of downgrading some sources or stations from global to session-wise parameters. These variants may have tiny but measurable effects when considering the current level of precision.
Among the main differences between the catalogs used in this work, we note that the AUS and BKG analyses start in 1993 and 1984, respectively, unlike all the other solutions, which start in 1979–1980. BKG did not include single-baseline and small network sessions, which are not suitable for reliable EOP determination. These choices make the number of observations for these two catalogs lower than for others, and could also be related to the largest median separations in the rightmost column of Table 1. Another noticeable particularity of the AUS solution is that it treats the station coordinates as session-wise parameters, while other solutions estimate them as global parameters over the entire observational time span (their motion being absorbed in the estimates of their velocity).
In terms of software packages, the ICRF3 was obtained through the Calc/Solve software package (Ma et al. 1986), similar in terms of analysis configuration to the configuration used by USN, OPA, and ASI. The VieVS software package (Böhm et al. 2018) used by the Vienna group, although written in a different programming language, is based on algorithms similar to Calc/Solve. In contrast, AUS is produced with the OCCAM software package (Titov et al. 2004), which uses a least-squares collocation method. In all solutions, source positions are constrained by a no-net rotation condition so that the celestial system remains oriented following the ICRS. Solutions AUS and BKG used the full set of 303 ICRF3 defining sources recommended in Charlot et al. (2020) while ASI, OPA, and USN removed from the no-net rotation condition four southern sources that were sparsely observed in the ICRF3 and whose positions are now away from the ICRF3 position by 0.5–1 mas. Similarly, VIE removed two southern sources from the no-net rotation (Krasna 2024). We also note that all catalogs give J2000.0 source positions with Galactic aberration corrected to 2015.0 using the value of 5.8 μas per year (MacMillan et al. 2019).
Each catalog was checked to detect double occurrences of sources (e.g., due to different naming conventions) and to unify the naming convention to the IERS name. 1830–21B is a gravitationally lensed image of 1830–211 (Djorgovski et al. 1992; Malkin 2018)4 and was removed from AUS and VIE. We also proceeded with a replacement of the inflated error for the USN and VIE catalogs by the original standard errors, following the noise floor and scale factor documented in the file header. We also reduced the ICRF3X standard errors using the coefficients specified in Charlot et al. (2020).
Roughly speaking, the combination will be a weighted average of the input catalogs. Before doing so, however, it is necessary to search for sources whose coordinates are strongly inconsistent in one or several catalogs and whose average would be meaningless. The source 0001–121 is present in AUS and OPA. Its position is incompatible by more than 40 arc seconds. It has been observed in only one session with four scans each. We decided to eliminate it from both catalogs. It will therefore not be in the final combined catalog. The source 1506–370 is present in AUS and USN. The latter position is derived from three sessions with 54 observations, while AUS used one session with 14 observations. As a consequence, the AUS formal errors are more than an order of magnitude larger while the USN formal error remains plausible. Therefore, we removed this source from AUS. Source 1550–238 is a Galactic star. Sources 0134+329 and 1328+254 have complicated structures and their positions may relate to different components for different catalogs, sessions, and/or periods of time (Titov et al. 2022) and are excluded from all catalogs. Similarly, sources 0132–097 and 1938+666 are gravitationally lensed and have been excluded from all catalogs (see Malkin (2018) for more comments on these and other sources). Then we computed a first combined catalog as simply the median positions of all catalogs and, for each source and each catalog, we computed the separation and normalized separation (as defined in Eqs. (4) and (5) of Mignard et al. 2016) to the median catalog. Then, we merged all the normalized separations into one single set of N = 32 963 points, regardless of the catalog. In the case of random position errors, this distribution is expected to be a Rayleigh distribution of parameter 1. For a data of length N, there should be no more points beyond a normalized separation of 4.7, whose percentile corresponds to a separation of 2.3 mas. Sources showing, in one catalog or more, positional differences to the median catalog beyond these limits should be considered as suspicious. Nevertheless, as the errors are not strictly Gaussian, we remain conservative by multiplying these thresholds by 10 (see Fig. 1). Sources in the bottom left quadrant of the figure (left of the vertical dashed line and below the horizontal dashed line) have their angular separation to the median catalog generally compensated by a large position error, thus making it statistically insignificant. Conversely, sources in the upper right corner, have both large angular separations and large normalized separation and are thought to be anomalous. We eliminated the sources that are in the upper right corner of the figure5.
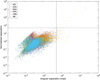 |
Fig. 1 Angular separation vs. normalized separation with respect to a combined catalog made up of the median positions of the six individual catalogs. The horizontal dashed line represents a critical normalized separation of 47 and the vertical dashed line a critical separation of 23 mas. |
3 Combination
3.1 General principles
The coordinates of a given source obtained from VLBI analysis depend on many factors that are intrinsic to the source or due to the analysis method. First, though the peculiar motions of quasars may remain without astrometric signatures due to their great distances from us, the VLBI reference points do exhibit a time-variable effective position, nonlinear and generally contained within few 0.1 mas, due to the evolution of the relativistic jet (e.g., Fey et al. 1997; Cigan et al. 2024; Makarov et al. 2024). Therefore, the positions given in an older catalog, for example the ICRF3 (obtained by processing data until 2018), are not expected to coincide with positions obtained by processing data until 2025. Second, as stated above, the choices made by analysis centers to process data has a noticeable influence on the random and systematic errors and on the number of sources appearing in the catalog. It turns out that different catalogs using different observational data sets and different analysis configurations and software packages are likely to provide source positions with significant differences.
The aim of the combination is to average several positions provided by different catalogs to a kind of optimal position. Here, the word optimal is unclear. It can signify just that the combined position aims at constituting a reference position, representative of the multiplicity of positions found by the various scientists, and not at being necessarily connected to the true (physical) position of the source. Conversely, if one considers that the true position lies between all catalogs, then one can expect the combination to be closer to the truth. Nevertheless, the source position given in a catalog can be thought of as the true position (to which no one has access) plus an additional error that can be systematic or random. Though the averaging process can lead to reducing the random Gaussian error, it will also lead to an accumulation of systematic errors. For this reason, combining catalogs need to separate random and systematic errors. Interestingly, the systematic errors of recent catalogs can be measured with respect to the latest official ICRF realization (ICRF3), which is older and is more likely to contain more intrinsic systematic errors than the up-to-date VLBI solutions. It turns out that measuring the systematic errors of the current catalogs with respect to the ICRF3 can be used to detect the systematic errors of the ICRF3 with respect to a better catalog (i.e., closer to the truth). From this point of view, the estimation of the systematic errors of the individual catalogs with respect to a reference catalog is a particularly important step, first because it will allow one to unify all individual catalogs to the same reference before averaging them into a combined catalog and second, it will use the estimated systematic errors to correct the obtained combined catalog and set it into a system that is independent from the ICRF3, but likely closer to the ideal system, thus becoming a better representation of the ICRS. These two steps are described below.
3.2 Estimation of systematic errors
Several expressions for modeling the coordinate differences on the sphere were used throughout the past decades, the simplest of them parameterizing the differences with three rotations around the three axes of the system and a declination bias accounting for a declination-dependent systematic error (Feissel-Vernier et al. 2006). A more general modeling is based on the vector spherical harmonic (VSH) decomposition of the coordinate differences, as developed by Mignard & Klioner (2012). The coordinate differences between two catalogs is expressed as
![Mathematical equation: $\[\Delta \alpha^*=\sum_{i j}\left(T_{i j, \alpha}^{\mathrm{Re}} t_{i j, \alpha}^{\mathrm{Re}}+S_{i j, \alpha}^{\mathrm{Re}} s_{i j, \alpha}^{\mathrm{Re}}+T_{i j, \alpha}^{\mathrm{Im}} t_{i j, \alpha}^{\mathrm{Im}}+S_{i j, \alpha}^{\mathrm{Im}} s_{i j, \alpha}^{\mathrm{Im}}\right),\]$](/articles/aa/full_html/2026/05/aa56388-25/aa56388-25-eq1.png) (1)
(1)
![Mathematical equation: $\[\Delta \delta=\sum_{i j}\left(T_{i j, \delta}^{\mathrm{Re}} t_{i j, \delta}^{\mathrm{Re}}+S_{i j, \delta}^{\mathrm{Re}} s_{i j, \delta}^{\mathrm{Re}}+T_{i j, \delta}^{\mathrm{Im}} t_{i j, \delta}^{\mathrm{Im}}+S_{i j, \delta}^{\mathrm{Im}} s_{i j, \delta}^{\mathrm{Im}}\right),\]$](/articles/aa/full_html/2026/05/aa56388-25/aa56388-25-eq2.png) (2)
(2)
where i and j are the degree and order of VSH function, respectively; Δα* = Δα cos δ; T and S are the toroidal and spheroidal VSH functions, respectively; and t and s are their amplitudes. We note that the question of whether deformations of other forms, not formally described by the VSH, should also be explored is open, especially in the context of the inhomogeneity of the coverage of the celestial sphere and the asymmetry of the VLBI network about the equator, possibly leading to nonsinusoidal systematics in declination (Jacobs 2015). Nevertheless, Liu et al. (2018) showed that using VSH to 1 = 2 eliminates most of the significant large-scale deformations.
Our aim was to capture the significant large-scale deformations that are generally confined within the low-degree harmonics such l ≤ 2, while higher harmonics become rapidly statistically nonsignificant. By fitting harmonics up to l = 10 to model the differences between the ICRF3X and the USN catalog over a set of 3132 sources (see the next two paragraphs about the identification and removal of outliers before the fit), we obtained that the significance (ratio of the VSH power to its error) dropped below 95% for l > 4 (Fig. 2), which suggests that taking l = 4 would be a good compromise to catch all the prominent and significant large-scale structures. We therefore adopt l = 4 in the following. This limit is reasonably adapted to the source distribution and density of sources in our sample (see discussion in Makarov et al. 2023).
This gives a 48-parameter transformation whose T and S functions are explicitly given in Table A.1. The degree 1 toroidal and spheroidal harmonics are directly related to the classical rotation and glide parameters used in previous works (e.g., Lambert 2014; Frouard et al. 2018; Charlot et al. 2020) following Eqs. (61)–(63) of Mignard & Klioner (2012) and Table 2 of Malkin (2025),
![Mathematical equation: $\[R_1+i R_2=t_{11},\]$](/articles/aa/full_html/2026/05/aa56388-25/aa56388-25-eq3.png) (3)
(3)
![Mathematical equation: $\[R_3=-t_{10},\]$](/articles/aa/full_html/2026/05/aa56388-25/aa56388-25-eq4.png) (4)
(4)
![Mathematical equation: $\[G_1+i G_2=-s_{11},\]$](/articles/aa/full_html/2026/05/aa56388-25/aa56388-25-eq5.png) (5)
(5)
![Mathematical equation: $\[G_3=s_{10},\]$](/articles/aa/full_html/2026/05/aa56388-25/aa56388-25-eq6.png) (6)
(6)
where the indices 1, 2, and 3 in R and G correspond to the X, Y, and Z axes of the ICRS, respectively.
There are 4065 sources in common to all the catalogs (including ICRF3X). The median separation between each catalog and the ICRF3X for the set of common sources is displayed in the rightmost column of Table 1. In each individual catalog there are sources for which the separation to ICRF3X is anomalously large with respect to the global distribution of the separations and can be considered as suspicious. Such sources could lead to biasing the estimates of global systematics between the catalogs and the reference. They should be identified, and rejected for estimating the transformation parameters. We considered rejecting sources matching at least one of these conditions: (i) the distance to the ICRF3X counterpart is larger than 5 mas; (ii) the overall distance error, defined as the ratio of the separation to the normalized separation as expressed in Mignard et al. (2016), is larger than 5 mas; and (iii) the normalized separation is larger than 5. The choice of the threshold is consistent with the values adopted in Charlot et al. (2020). The elimination of outliers left a set of 3132 common sources.
The VSH parameters were then adjusted by a standard least-squares algorithm to coordinate the differences weighted by the inverse of the squared standard errors and to account for correlations between the estimates of right ascension and declination. The VSH amplitudes are displayed in Fig. 3 with error bars showing the 95% CI. The unit variance factor is given in Table 2 along with the overall amplitude (root sum squared) of the VSH coefficients and the postfit rms; we note the correlation between the postfit rms and the median separation in Table 1. When larger than 1, σ2 generally suggests model errors, biases, or underestimated standard errors. In contrast, values lower than 1 may result from overestimated standard errors. Here again, we note the deviation from unity for AUS, while for other catalogs (except BKG) σ2 is more reasonably close to 1, indicating that once large-scale systematics are removed, the remaining offsets are of a stochastic nature with few significant offsets. Then we transformed all the input catalogs into the ICRF3X system by applying the estimated VSH.
The rotations have no physical meaning, but generally result from pure reference frame effects (e.g., choice of the defining set of sources and strength of the no-net rotation constraint). The presence of a glide can hide the signature of different effects, following its apex. The north–south network asymmetry, because it has a lack of sources in the south and a thicker atmosphere to cross for the southern sources (observed from the north), is likely to result in north–south dipole, which is a declination-dependent error. In contrast, an uncorrected acceleration of the observer’s frame with respect to the quasar’s rest frame, which is the Solar System acceleration in the universe (see Kovalevsky 2003; Titov et al. 2011; Xu et al. 2012; Titov & Lambert 2013; Malkin 2014, and references therein), will produce a glide whose apex is close to the Galactic center. The complex shape of these systematic errors that, to a different extent, depend on declination, appear to be better modeled by a combination of dipolar and quadripolar terms. The reason for the significant departure of S11 and S21 in the OPA catalog is unclear, however, as OPA uses an analysis configuration very close to USN and ASI and the Galactic aberration was corrected in the same way as in the other solutions with the value of 5.8 μas per year recommended by MacMillan et al. (2019); Charlot et al. (2020). Except for these two anomalous terms in OPA, all the catalogs globally show the same departures from the ICRF3X, most of them being not or poorly statistically significant.
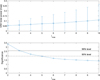 |
Fig. 2 Total power of the VSH amplitudes fitted to the coordinate differences between ICRF3X and USN catalogs (top; error bars are the 95% CI) and its statistical significance (bottom) for a maximum VSH order lmax between 2 and 10. |
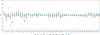 |
Fig. 3 VSH amplitudes modeling the coordinate difference between the catalogs and ICRF3X with their 95% CI. |
Root sum squared (RSSQ) of the VSH amplitudes (in mas), the unit variance factor (UVF, dimensionless), and the postfit rms (in mas).
3.3 Combination in the ICRF3 system
The positions of the sources from all individual catalogs are then combined, i.e., averaged. The nonzero correlation between the estimates of right ascension and declination makes the source-wise correlation matrix have nondiagonal terms. To propagate this covariance information into the average values, we use a covariance-weighted mean. For a given source that has coordinates xi = (αi, δi)T in the i-th catalog, the average position ![Mathematical equation: $\[\bar{x}=(\bar{\alpha}, \bar{\delta})^{T}\]$](/articles/aa/full_html/2026/05/aa56388-25/aa56388-25-eq7.png) over n catalogs is
over n catalogs is
![Mathematical equation: $\[\bar{x}=\left(\sum_{i=1}^n Q_i^{-1}\right)^{-1} \sum_{i=1}^n Q_i^{-1} x_i,\]$](/articles/aa/full_html/2026/05/aa56388-25/aa56388-25-eq8.png) (7)
(7)
where
![Mathematical equation: $\[Q_i=\left(\begin{array}{cc}\sigma_{\alpha_i^*}^2 & \sigma_{\alpha_i^*} \sigma_{\delta_i} \rho_i \\\sigma_{\alpha_i^*} \sigma_{\delta_i} \rho_i & \sigma_{\delta_i}^2\end{array}\right),\]$](/articles/aa/full_html/2026/05/aa56388-25/aa56388-25-eq9.png) (8)
(8)
where ρi is the correlation between αi and δi. Then the covariance matrix of the average position is a 2 × 2 matrix whose nondiagonal terms express the covariance between the ![Mathematical equation: $\[\bar{\alpha}\]$](/articles/aa/full_html/2026/05/aa56388-25/aa56388-25-eq10.png) and
and ![Mathematical equation: $\[\bar{\delta}\]$](/articles/aa/full_html/2026/05/aa56388-25/aa56388-25-eq11.png) :
:
![Mathematical equation: $\[Q_{\bar{x}}=\left(\sum_{i=1}^n Q_i^{-1}\right)^{-1}.\]$](/articles/aa/full_html/2026/05/aa56388-25/aa56388-25-eq12.png) (9)
(9)
The formal uncertainties on the averaged coordinates are then
![Mathematical equation: $\[\sigma_{\bar{\alpha}^*}=\sqrt{Q_{\bar{x}, 11}},\]$](/articles/aa/full_html/2026/05/aa56388-25/aa56388-25-eq13.png) (10)
(10)
![Mathematical equation: $\[\sigma_{\bar{\delta}}=\sqrt{Q_{\bar{x}, 22}},\]$](/articles/aa/full_html/2026/05/aa56388-25/aa56388-25-eq14.png) (11)
(11)
and the correlation between α and δ is
![Mathematical equation: $\[\rho(\bar{\alpha}, \bar{\delta})=\frac{Q_{\bar{x}, 12}}{\sqrt{Q_{\bar{x}, 11} Q_{\bar{x}, 22}}}.\]$](/articles/aa/full_html/2026/05/aa56388-25/aa56388-25-eq15.png) (12)
(12)
The catalog obtained by the covariance-weighted mean of all input catalogs is called COMB1X.
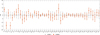 |
Fig. 4 VSH amplitudes modeling the coordinate difference between the combined catalogs and the ICRF3X with their 95% CI. |
3.4 Combination in the independent system
The catalog COMB1X is aligned with the ICRF3X catalog and is expressed in the ICRS system, as realized by the ICRF3. Nevertheless, the larger-scale systematics presented in Fig. 3 can be interpreted as systematic errors of the ICRF3X with respect to more accurate ICRS realizations made up of more recent VLBI solutions, which means that that the ICRS is no longer realized ideally by the ICRF3X, but rather by an average of the current VLBI solutions. In that case, if one wants to express the previously obtained combined catalog COMB1X in such systems, one has to apply to the source coordinates a transformation whose amplitude is given by the average of the systematic errors of the individual catalogs. Similarly to Sokolova & Malkin (2014), we propose computing a weighted average of the previously found VSH amplitudes, where the weights are based on the VSH deviation from the mean systematic error. The determination of the mean VSH is made iteratively, starting from a simple unweighted average. At each iteration, the VSH deviation from the mean is computed (as the rms of the VSH amplitude differences) and new weights are formed by its squared inverse. The process is iterated until the weights converge. The final mean VSH amplitudes are added to the COMB1X catalog, thereby forming the COMB2X catalog.
The VSH amplitudes of the transformation between COMB2X and ICRF3X are displayed in Fig. 4. The COMB2X system exhibits a rotation of ~15 μas about the Y-axis as well as a glide about the Z-axis of similar amplitude. The associated vector field, excluding rotation terms, is represented in Fig. 5 and is not particularly revealing. It results mainly from the superimposition of degree 2 harmonics (which may result partly from the north–south asymmetry of the source distribution, with a lack of sources in the southern hemisphere) with higher degrees that may result from smaller-scale inhomogeneities (e.g., higher density of sources in the ecliptic or other regions of density lower than the average).
The obtained COMB2X catalog contains 5825 sources, of which 4689 (80.5%) are present in all six of the catalogs, 649 (11.1%) are present in five catalogs, 312 (5.4%) in four catalogs, 54 (0.9%) in three catalogs, 42 (0.7%) in two catalogs, and 79 (1.4%) in only one catalog. It is made available electronically. In addition to the right ascension, declination, and their errors, we also provide the correlation between estimates of right ascension and declination and, similarly to the usual IVS format, the number of sessions and delays relevant to each source, and the associated initial, final, and mean observation epochs. As we combined catalogs that are not independent, in the sense that they were obtained through the analysis of largely common set of VLBI sessions and delays, the reported number of sessions (delays) for a given source is the maximum number of sessions (delays) across all individual catalogs. Similarly, the minimum (maximum) epoch is the minimum (maximum) epoch across all catalogs.
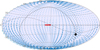 |
Fig. 5 Vector field of the systematic errors between COMB2X and ICRF3X, excluding harmonics T10 and T11 (rotations). The bold red line at the center represents an amplitude of 50 μas. The black curve is the Galactic equator. The black disk is the Galactic center. The dashed curve is the ecliptic. |
3.5 Determination of realistic errors
The median error ellipse semimajor axis (EESMA, defined in Eq. (1) of Mignard et al. 2018) of COMB2X is 0.051 mas for the whole ensemble of sources. A comparison of the error ellipses of the combined catalog with those of the ICRF3X deflated errors for the set of 3132 common sources used for fitting systematics reveals that error ellipse eccentricity and position angle are similarly distributed in the two catalogs (first row of Fig. 6). However, though the shape of the distribution of the EESMA is similar for both catalogs, the EESMA for COMB2X has a median of 0.051 mas, whereas it is 0.142 mas for ICRF3X (non-inflated error), which is a reduction of a factor of 2.7 due to the statistical averaging. The minimum formal error in COMB2X appears to be 3 μas, which is somehow unrealistic given that such low levels of uncertainty result from the scaling of errors by the inverse of the squared number of observations and, to a lesser extent for a combination of several catalogs, the number of catalogs. We note that the positional error is lower for sources observed in a larger number of catalogs, but this is essentially because these sources are also those that are the most observed in the VLBI program, and thus have the largest number of delays. Moreover, the catalogs are not statistically independent as they all use common data and a largely common analysis configuration. Additionally, the positional difference of a source between all catalogs is generally larger than its COMB2X formal error, suggesting that formal errors obtained from the covariance-weighted mean of positions in all six catalogs are definitely too optimistic.
The underestimation of errors should be addressed to provide positions with errors that are as realistic as possible. In particular, positional error should not only reflect the number of observations but also the level of agreement between the different attempts to determine the position by different analysis centers with some variants in the analysis configuration or software package. To evaluate the robustness of the position resulting from a combination, we generated 20 combinations made with all possible groups of three catalogs among the six catalogs. Then, we considered pairs of combined catalogs formed in this way, and considered the positional differences between the common sources versus the EESMA in COMB2X (see Fig. 7). Assuming a linear relationship between the squared COMB2X EESMA and the squared positional differences between the two partial combinations, the square roots of the slope coefficient and the intercept can be interpreted as a scale factor s and a noise floor f, respectively. We fitted these coefficients to the data for each of the 190 pairs available and found median values of s = 1.2 and f = 0.015 mas. We therefore replaced in COMB2X the previously obtained formal standard errors with more realistic errors increased by these coefficients following ![Mathematical equation: $\[\sigma_{\alpha^{*}}^{2}=\left(s \sigma_{\alpha^{*}, \text {formal}}\right)^{2}+f^{2}\]$](/articles/aa/full_html/2026/05/aa56388-25/aa56388-25-eq16.png) and
and ![Mathematical equation: $\[\sigma_{\delta}^{2}=\left(s \sigma_{\delta, \text {formal}}\right)^{2}+f^{2}\]$](/articles/aa/full_html/2026/05/aa56388-25/aa56388-25-eq17.png) . The distribution of new EESMA compared to the ICRF3X is shown in the second row of Fig. 6.
. The distribution of new EESMA compared to the ICRF3X is shown in the second row of Fig. 6.
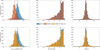 |
Fig. 6 Top row: comparison of the distribution of error ellipse semimajor axis (EESMA), eccentricities, and semimajor axis position angle (EEPA) for common sources of COMB2X and ICRF3X. The vertical lines indicate the median value of each distribution. The ICRF3X EESMA is computed with the deflated errors. Bottom row: same, but for COMB2X with inflated errors (see Sect. 3.5). |
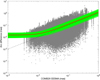 |
Fig. 7 Source-wise positional difference (angular separation) between 190 pairs of the 20 partial combinations (gray dots) made with three catalogs of six as a function of the EESMA in COMB2X. The green curves result from a linear fit between the pair-wise squared COMB2X EESMA and squared positional differences. The red curve is the median fit. The dashed line represents an arc difference equal to the COMB2X EESMA. |
4 External checks
Very long baseline interferometry provides the orientation of the terrestrial coordinate system with respect to the celestial coordinate system, the latter being materialized, imperfectly, by radio source positions. The imperfection of such materialization can impact the estimation of the orientation of the Earth’s figure axis with respect to a fixed direction in space, which is called celestial pole offset (CPO). This makes the CPO (in practice, two nutation angles or two celestial pole Cartesian coordinates) a good proxy for assessing the quality of a catalog made up of thousands of source coordinates. Sokolova & Malkin (2007) computed session-wise CPO time series for all sessions of the IVS rapid turn-around program (IVS-R1 and IVS-R4 sessions) between 2002 and 2005, all sources being fixed alternatively to the ICRF and to their combined catalog. They found that using the combined catalog provided a less noisy CPO time series. We reproduced this test by generating CPO time series using the Calc/Solve geodetic VLBI analysis software package (Ma et al. 1986) of the Paris Observatory IVS analysis center (Lambert et al. 2021a), and processing all IVS-R1 and IVS-R4 sessions between 2002 and 2025. We found no significant differences between the nutation series, a result that is not contradictory since the differences between COMB2X and the ICRF3 are much smaller than those between the ICRF2 and the combined catalog used by Sokolova & Malkin (2007).
Another external check of the combined catalog COMB2X was performed through a comparison with the independent optical celestial reference frame system based on the optical positions determined by the European Space Agency mission Gaia (Prusti et al. 2016), Gaia-CRF3 with a precision comparable with the state-of-the-art VLBI CRF realization. Although the optical positions are not expected to coincide with the radio positions, for example due to differences in the position of the emission region and emission mechanisms (e.g., Kovalev et al. 2017; Plavin et al. 2019; Lambert et al. 2021b, 2024), these optical-radio offsets are not expected to be spatially correlated, so that there should ideally be no large-scale systematic error between optical and radio positions. Moreover the Gaia frame does not contain the declination-dependent errors traditionally found in VLBI catalogs, so that a comparison between VLBI and Gaia positions can be used to appreciate such VLBI zonal errors. Table 3 presents the weighted rms (wrms) differences between Gaia-CRF3 (hereafter GCRF3; Klioner et al. 2022) and both radio catalogs ICRF3X and COMB2X in right ascension, declination, and angular distance for 2419 sources common to the three catalogs, after rejecting outliers using the criteria described above. The values reveal that the COMB2X positions are closer to the optical than the ICRF3X positions. To estimate the significance of the improvement in the agreement between radio and optical catalogs, we used an F-test applied to the variance ratio of the distances between optical and radio positions:
![Mathematical equation: $\[F=\frac{\mathrm{WRMS}^2(\mathrm{ICRF} 3 \mathrm{X}-\mathrm{GCRF} 3)}{\mathrm{WRMS}^2(\mathrm{COMB} 2 \mathrm{X}-\mathrm{GCRF} 3)}.\]$](/articles/aa/full_html/2026/05/aa56388-25/aa56388-25-eq18.png) (13)
(13)
We obtained F = 1.2862, which corresponds to the significance level of 3 × 10⁻¹⁰ for the degree of freedom of 2418. This means that a significant improvement is observed with a probability of 99.99999997%. At the level of global systematic errors, Fig. 8 shows the VSH amplitudes modeling the coordinate differences between GCFR3 and the two radio catalogs, revealing the reduction of the T21 and S21 terms in COMB2X.
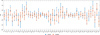 |
Fig. 8 VSH amplitudes modeling the coordinate difference between the Gaia-CRF3 and both of COMB2X and ICRF3X, with their 95% CI. |
Weighted rms differences between Gaia-CRF3 (GCRF3) and the radio catalogs ICRF3X and COMB2X.
5 Conclusions
We described a method for combining VLBI radio source position catalogs into a single catalog. Our methodology is based on (i) setting all individual catalogs in the same system by fitting and removing large-scale systematics with respect to a known reference representing at best the conventional system, (ii) applying a covariance-weighted average of all catalogs expressed in the same system, (iii) setting the combined catalog into an independent system defined by the mean systematics with respect to reference catalog, and (iv) rescaling the positional errors to realistic values that account for positional dispersion between the existing catalogs.
The combined catalog COMB2X is based on many more observations than the ICRF3, which allows us to improve precision and address systematics of the ICRF3 catalog, pushing accuracy limits to achieve a state-of-the-art VLBI astrometry. It contains slightly more sources than all the input catalogs. It offers an up-to-date representation of the ICRS mitigated by the particularities of individual catalogs (e.g., variations in the analysis configuration, analysis software packages). As an additional benefit, the combination procedure described above proved to be useful for detecting problematic sources and inconsistencies in individual catalogs. This feedback could help IVS analysis centers to refine their analysis procedures.
The input catalogs cannot be considered fully independent as they share largely the same observations and use similar analysis methods (algorithms) and configurations. However, a comparison of these catalogs shows significant differences between individual source positions, as well as systematic differences. In such a case, combining catalogs can improve the accuracy of the VLBI CRF realization, and provide a CRF that is more dense and more representative of the state-of-the-art VLBI astrometry. Here, an analogy can be seen between the combination of CRFs and intratechnique combinations of Earth’s orientation parameters (EOP) time series. For a given space geodesy technique, all the relevant analysis centers process the same observations. Nevertheless, combined EOP series are generally considered to be superior with respect to individual EOP solutions (see for example Kouba et al. 2000; Böckmann et al. 2010, for IGS and IVS EOP combination, respectively), which is the basis of the multitechnique combination of the IERS (Bizouard et al. 2019).
Of course, the quality of a combined catalog depends decisively on the methodology used. The quality of the input catalogs may be (and often is) quite different. Therefore, a key point for the quality of a combined catalog is their weighting, including rejecting and/or downweighting input catalogs of low quality so that the combined catalog will have a desirable advantage with respect to individual catalogs in both precision and accuracy. Finally, only a comparison with an independent ICRS realization, primarily with Gaia-CRF, can confirm a systematic improvement of a VLBI catalog with respect to others. However, one should bear in mind that the Gaia-CRF3 was aligned to the ICRF3 S/X solution and thus the ICRF3 should be closer to Gaia, at least in sense of rotation, than a better VLBI catalog. In the present work, the comparison with the Gaia-CRF3 positions revealed that the combined catalog has marginally lower systematics with respect to the optical frame than the ICRF3.
This work, the preparation of the next ICRF, and the general context of making catalogs of reference points with sub-mas accuracy also raise the problem of whether the source position can be reasonably modeled by a single point given that the evolution of the relativistic jet structure generally moves the VLBI reference point by a few 0.01 mas/yr to several milliarcseconds per year in extreme cases (see, e.g., Gattano & Charlot 2021; Makarov et al. 2024; Cigan et al. 2024, and references therein). There are exceptional cases of complex structure spread over tens of milliarcseconds with different components dominating the flux at different time periods (see, e.g., CTA 21 (0316+162) or 3C 48 (0134-129) in Titov et al. 2022). For such sources, delivering one single position in the catalog could be confusing as (i) the astrometric reference point obtained by a global solution falls between the bright components and is thereby unrelated to any physical region of the object and (ii) the position estimated from a single session would fall on the brightest component at the observing epoch, which could be relatively far from the position estimated from the global solution. Similar issues can arise in gravitationally lensed images. For such cases, astrometric catalogs could consider delivering different entries for the different components, regardless of whether they are physically related components of a single source or whether they are just close projections on the celestial sphere. Considering, for example, the source 0134+329 analyzed by Titov et al. (2022), its position time series shows a jump of about 50 mas between the 1990s and the 2010–2020s, and its map shows a complex structure with two dominant components. In this case, we can treat sessions conducted in the 1990s as observing the source 0134+32A, and sessions conducted after the position jump as observing the source 0134+32B. Such a procedure can only be applied to sources for which we can confirm their structure by source mapping. If there are two real radio centroids, there should ideally be two entries in the position catalogs. Solving this problem requires improving our ability to resolve close objects in the field of view, which is a challenge for both correlators and analysis groups.
Further developments of the combination procedure may include accounting for the full covariance information of the input catalogs (i.e., not only the correlation between right ascension and declination estimates for each source, but also between sources), which can significantly affect the results of determination of the parameters of mutual orientation between the catalogs and, more generally, the amplitudes of the vector spherical harmonics describing the large-scale systematics (Jacobs et al. 2010; Sokolova & Malkin 2016). However, such an extension requires that the analysis centers publish their radio source catalogs with a full covariance matrix (e.g., in the SINEX6 format).
Our method is straightforward as it relies on catalogs, thus requiring a minimal contribution from analysis centers. It differs from more ambitious but heavier methods based on combining normal equation systems or even observations. The latter methods would have the advantage of determining simultaneously the celestial reference frame, the terrestrial reference frame, and the Earth’s orientation parameters in a single global inversion (Bachmann & Thaller 2017), but they are still at the level of development.
Data availability
The catalog is available at the CDS via https://cdsarc.cds.unistra.fr/viz-bin/cat/J/A+A/709/A98.
Acknowledgements
The authors thank Christopher Jacobs for his deep review of the manuscript. They express their gratitude to IVS Analysis Centers that have made their radio source position catalogs publicly available. This work has made use of data from the European Space Agency (ESA) mission Gaia (https://www.cosmos.esa.int/gaia), processed by the Gaia Data Processing and Analysis Consortium (DPAC). Funding for the DPAC has been provided by national institutions, in particular the institutions participating in the Gaia Multilateral Agreement.
References
- Arias, E. F., Charlot, P., Feissel, M., & Lestrade, J.-F. 1995, A&A, 303, 604 [Google Scholar]
- Bachmann, S., & Thaller, D. 2017, J. Geod., 91, 743 [Google Scholar]
- Bizouard, C., Lambert, S., Gattano, C., Richard, J.-Y., & Becker, O. 2019, J. Geod., 93, 621 [Google Scholar]
- Böckmann, S., Artz, T., Nothnagel, A., & Tesmer, V. 2010, J. Geophys. Res., 115, B04404 [Google Scholar]
- Böhm, J., Böhm, S., Boisits, J., et al. 2018, PASP, 130, 044503 [CrossRef] [Google Scholar]
- Charlot, P. 2025, in Proceedings of the 13th International VLBI Service for Geodesy and Astrometry General Meeting, eds. D. Behrend, K. D. Baver, & K. L. Armstrong, 300 [Google Scholar]
- Charlot, P., Jacobs, C. S., Gordon, D., et al. 2020, A&A, 644, A159 [EDP Sciences] [Google Scholar]
- Cigan, P., Makarov, V. V., Secrest, N. J., et al. 2024, ApJS, 274, 28 [Google Scholar]
- Djorgovski, S., Meylan, G., Klemola, A., et al. 1992, MNRAS, 257, 240 [Google Scholar]
- Feissel, M., & Mignard, F. 1998, A&A, 331, L33 [Google Scholar]
- Feissel-Vernier, M., Ma, C., Gontier, A.-M., & Barache, C. 2006, A&A, 452, 1107 [NASA ADS] [CrossRef] [EDP Sciences] [Google Scholar]
- Fey, A. L., Eubanks, M., & Kingham, K. A. 1997, AJ, 114, 2284 [CrossRef] [Google Scholar]
- Fey, A. L., Gordon, D., Jacobs, C. S., et al. 2015, AJ, 150, 58 [Google Scholar]
- Fricke, W., Kopff, A., Gliese, W., et al. 1963, Veroeffentlichungen des Astronomischen Rechen-Instituts Heidelberg, 10, 1 [Google Scholar]
- Fricke, W., Schwan, H., Lederle, T., et al. 1988, Veroeffentlichungen des Astronomischen Rechen-Instituts Heidelberg, 32, 1 [NASA ADS] [Google Scholar]
- Frouard, J., Johnson, M. C., Fey, A., Makarov, V. V., & Dorland, B. N. 2018, AJ, 155, 229 [Google Scholar]
- Gattano, C., & Charlot, P. 2021, A&A, 648, A125 [NASA ADS] [CrossRef] [EDP Sciences] [Google Scholar]
- Jacobs, C. 2015, IAU General Assembly, 29, 2256495 [Google Scholar]
- Jacobs, C. S., Heflin, M. B., Lanyi, G. E., Sovers, O. J., & Steppe, J. A. 2010, in Proceefings of the 6th International VLBI Service for Geodesy and Astronomy General Meeting, eds. R. Navarro, S. Rogstad, C. E. Goodhart, et al., 305 [Google Scholar]
- Karbon, M., & Nothnagel, A. 2019, A&A, 630, A101 [NASA ADS] [CrossRef] [EDP Sciences] [Google Scholar]
- Klioner, S. A., Lindegren, L., Mignard, F., et al. 2022, A&A, 667, A148 [NASA ADS] [CrossRef] [EDP Sciences] [Google Scholar]
- Kouba, J., Beutler, G., & Rothacher, M. 2000, ASP Conf. Ser., 208, 277 [Google Scholar]
- Kovalev, Y. Y., Petrov, L., & Plavin, A. V. 2017, A&A, 598, L1 [NASA ADS] [CrossRef] [EDP Sciences] [Google Scholar]
- Kovalevsky, J. 2003, A&A, 404, 743 [NASA ADS] [CrossRef] [EDP Sciences] [Google Scholar]
- Krasna, H. 2024, https://researchdata.tuwien.at/records/yt390-wfm94 [Google Scholar]
- Lambert, S. 2014, A&A, 570, A108 [NASA ADS] [CrossRef] [EDP Sciences] [Google Scholar]
- Lambert, S., Barache, C., & Carlucci, T. 2021a, in International VLBI Service for Geodesy and Astrometry 2019+2020 Biennial Report, eds. K. L. A. D. Behrend & K. D. Baver, NASA-TP-20210021389 [Google Scholar]
- Lambert, S., Liu, N., Arias, E. F., et al. 2021b, A&A, 651, A64 [NASA ADS] [CrossRef] [EDP Sciences] [Google Scholar]
- Lambert, S., Sol, H., & Pierron, A. 2024, A&A, 684, A202 [NASA ADS] [CrossRef] [EDP Sciences] [Google Scholar]
- Liu, N., Zhu, Z., & Liu, J.-C. 2018, A&A, 609, A19 [NASA ADS] [CrossRef] [EDP Sciences] [Google Scholar]
- Ma, C., Clark, T. A., Ryan, J. W., et al. 1986, AJ, 92, 1020 [NASA ADS] [CrossRef] [Google Scholar]
- Ma, C., Arias, E., Eubanks, T., et al. 1998, AJ, 116, 516 [Google Scholar]
- MacMillan, D. S., Fey, A., Gipson, J. M., et al. 2019, A&A, 630, A93 [NASA ADS] [CrossRef] [EDP Sciences] [Google Scholar]
- Makarov, V. V., Dorland, B. N., Gaume, R. A., et al. 2012, AJ, 144, 22 [Google Scholar]
- Makarov, V. V., Johnson, M. C., & Secrest, N. J. 2023, AJ, 166, 8 [Google Scholar]
- Makarov, V. V., Cigan, P., Gordon, D., et al. 2024, ApJ, 977, L14 [NASA ADS] [CrossRef] [Google Scholar]
- Malkin, Z. 2014, MNRAS, 445, 845 [Google Scholar]
- Malkin, Z. 2018, ApJS, 239, 20 [Google Scholar]
- Malkin, Z. 2025, AJ, 170, 48 [Google Scholar]
- Mignard, F., & Klioner, S. 2012, A&A, 547, A59 [NASA ADS] [CrossRef] [EDP Sciences] [Google Scholar]
- Mignard, F., Klioner, S., Lindegren, L., et al. 2016, A&A, 595, A5 [NASA ADS] [CrossRef] [EDP Sciences] [Google Scholar]
- Mignard, F., Klioner, S. A., Lindegren, L., et al. 2018, A&A, 616, A14 [NASA ADS] [CrossRef] [EDP Sciences] [Google Scholar]
- Nothnagel, A., Artz, T., Behrend, D., & Malkin, Z. 2017, J. Geodesy, 91, 711 [NASA ADS] [CrossRef] [Google Scholar]
- Perryman, M. 1997, ESA SP, 1200 [Google Scholar]
- Petit, G., & Luzum, B., 2010, IERS Technical Note 36: IERS Conventions 2010 (Germany: Verlag des Bundesamts für Kartographie und Geodäsie) [Google Scholar]
- Plavin, A. V., Kovalev, Y. Y., & Petrov, L. Y. 2019, ApJ, 871, 143 [Google Scholar]
- Porcas, R. W. 2009, A&A, 505, L1 [NASA ADS] [CrossRef] [EDP Sciences] [Google Scholar]
- Prusti, T., de Bruijne, J. H. J., Brown, A. G. A., et al. 2016, A&A, 595, A1 [NASA ADS] [CrossRef] [EDP Sciences] [Google Scholar]
- Sokolova, J., & Malkin, Z. 2007, A&A, 474, 665 [NASA ADS] [CrossRef] [EDP Sciences] [Google Scholar]
- Sokolova, Y. R., & Malkin, Z. M. 2014, Astron. Lett., 40, 268 [Google Scholar]
- Sokolova, Y., & Malkin, Z. 2016, in Proceedings of the IAG Scientific Assembly 2013, ed,. C. Rizos, & P. Willis, 41 [Google Scholar]
- Titov, O., & Lambert, S. 2013, A&A, 559, A95 [NASA ADS] [CrossRef] [EDP Sciences] [Google Scholar]
- Titov, O., Tesmer, V., & Boehm, J. 2004, in Proceedings of the 3rd International VLBI Service for Geodesy and Astrometry General Meeting Proceedings, eds. N. R. Vandenberg & K. D. Baver, 267 [Google Scholar]
- Titov, O., Lambert, S. B., & Gontier, A.-M. 2011, A&A, 529, A91 [NASA ADS] [CrossRef] [EDP Sciences] [Google Scholar]
- Titov, O., Frey, S., Melnikov, A., et al. 2022, MNRAS, 512, 874 [NASA ADS] [CrossRef] [Google Scholar]
- Xu, M. H., Wang, G. L., & Zhao, M. 2012, A&A, 544, A135 [NASA ADS] [CrossRef] [EDP Sciences] [Google Scholar]
See also the optical characteristics of astrometric radio sources (OCARS) files at https://www.gaoran.ru/english/as/ac_vlbi/index.htm#OCARS
The following sources were eliminated (in addition to the sources mentioned earlier in the paragraph): AUS: 1349+027, 1507+161, 1825–307, 2319+461; BKG: 0222–262, 0316+162, 0743–247, 1228–008, 1524–136, 1616+851, 2318–195.
Appendix A VSH decomposition up to degree 4
Table A.1 gives the formulae for the 48 terms of the VSH decomposition up to degree 4 as used in this work, for direct use in Eqs. (1) and (2).
Toroidal (T) and spheroidal (S) VSH functions.
All Tables
Root sum squared (RSSQ) of the VSH amplitudes (in mas), the unit variance factor (UVF, dimensionless), and the postfit rms (in mas).
Weighted rms differences between Gaia-CRF3 (GCRF3) and the radio catalogs ICRF3X and COMB2X.
All Figures
|
Fig. 1 Angular separation vs. normalized separation with respect to a combined catalog made up of the median positions of the six individual catalogs. The horizontal dashed line represents a critical normalized separation of 47 and the vertical dashed line a critical separation of 23 mas. |
| In the text | |
|
Fig. 2 Total power of the VSH amplitudes fitted to the coordinate differences between ICRF3X and USN catalogs (top; error bars are the 95% CI) and its statistical significance (bottom) for a maximum VSH order lmax between 2 and 10. |
| In the text | |
|
Fig. 3 VSH amplitudes modeling the coordinate difference between the catalogs and ICRF3X with their 95% CI. |
| In the text | |
|
Fig. 4 VSH amplitudes modeling the coordinate difference between the combined catalogs and the ICRF3X with their 95% CI. |
| In the text | |
|
Fig. 5 Vector field of the systematic errors between COMB2X and ICRF3X, excluding harmonics T10 and T11 (rotations). The bold red line at the center represents an amplitude of 50 μas. The black curve is the Galactic equator. The black disk is the Galactic center. The dashed curve is the ecliptic. |
| In the text | |
|
Fig. 6 Top row: comparison of the distribution of error ellipse semimajor axis (EESMA), eccentricities, and semimajor axis position angle (EEPA) for common sources of COMB2X and ICRF3X. The vertical lines indicate the median value of each distribution. The ICRF3X EESMA is computed with the deflated errors. Bottom row: same, but for COMB2X with inflated errors (see Sect. 3.5). |
| In the text | |
|
Fig. 7 Source-wise positional difference (angular separation) between 190 pairs of the 20 partial combinations (gray dots) made with three catalogs of six as a function of the EESMA in COMB2X. The green curves result from a linear fit between the pair-wise squared COMB2X EESMA and squared positional differences. The red curve is the median fit. The dashed line represents an arc difference equal to the COMB2X EESMA. |
| In the text | |
|
Fig. 8 VSH amplitudes modeling the coordinate difference between the Gaia-CRF3 and both of COMB2X and ICRF3X, with their 95% CI. |
| In the text | |
Current usage metrics show cumulative count of Article Views (full-text article views including HTML views, PDF and ePub downloads, according to the available data) and Abstracts Views on Vision4Press platform.
Data correspond to usage on the plateform after 2015. The current usage metrics is available 48-96 hours after online publication and is updated daily on week days.
Initial download of the metrics may take a while.