Fig. 7
Download original image
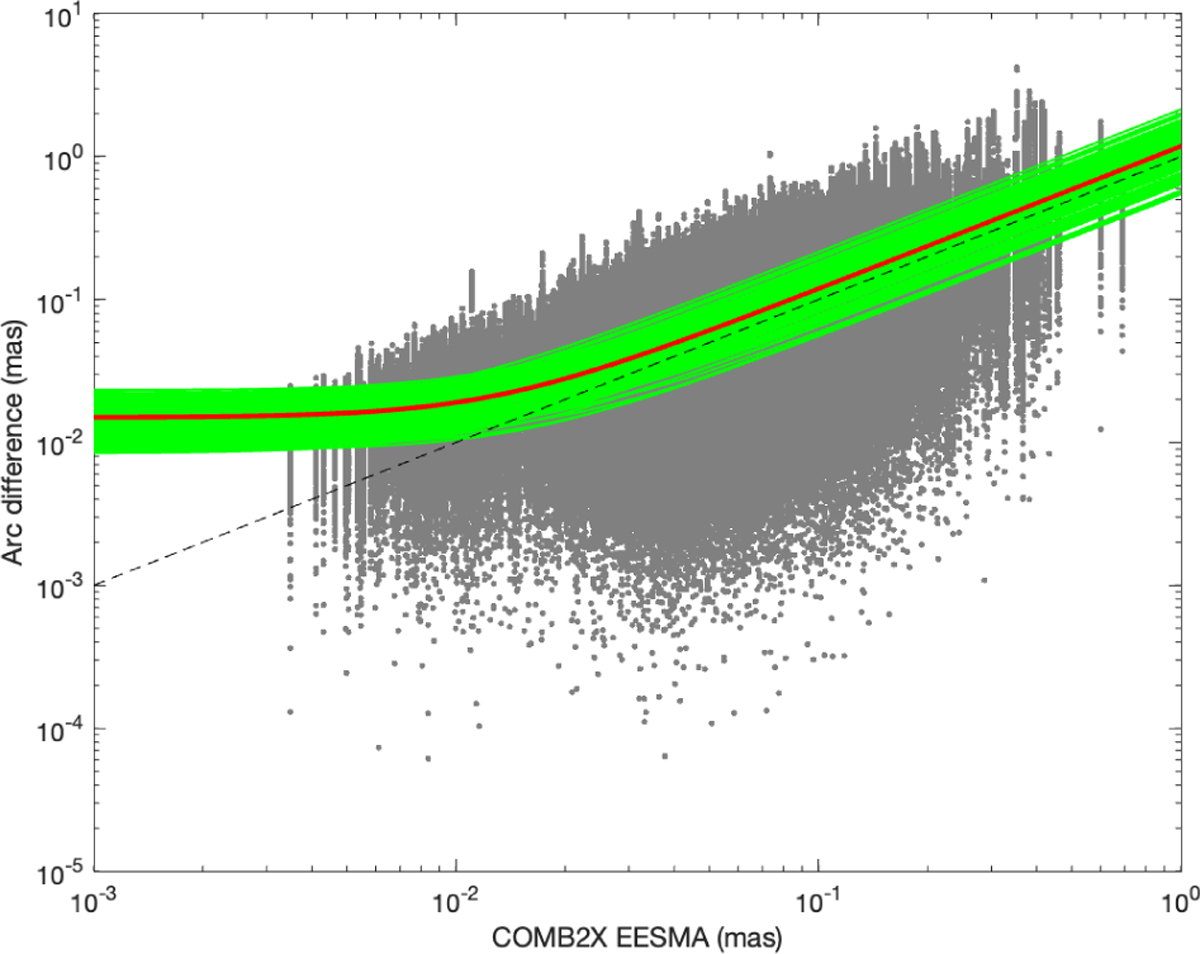
Source-wise positional difference (angular separation) between 190 pairs of the 20 partial combinations (gray dots) made with three catalogs of six as a function of the EESMA in COMB2X. The green curves result from a linear fit between the pair-wise squared COMB2X EESMA and squared positional differences. The red curve is the median fit. The dashed line represents an arc difference equal to the COMB2X EESMA.
Current usage metrics show cumulative count of Article Views (full-text article views including HTML views, PDF and ePub downloads, according to the available data) and Abstracts Views on Vision4Press platform.
Data correspond to usage on the plateform after 2015. The current usage metrics is available 48-96 hours after online publication and is updated daily on week days.
Initial download of the metrics may take a while.