Open Access
Fig. 2
Download original image
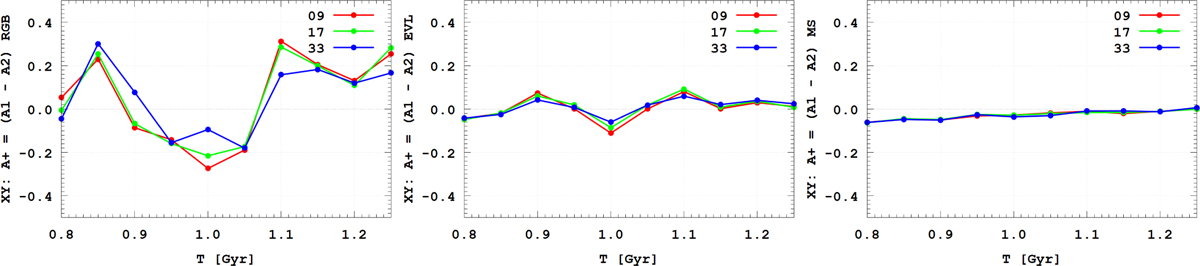
Time evolution of the A+ parameter for different types of stars and for the X–Y projection of 3D snapshots. Left: RGB stars. Middle: evolved luminous stars. Right: MS stars. The red, green, and blue lines are averaged over 9, 17, and 33 snapshots, respectively.
Current usage metrics show cumulative count of Article Views (full-text article views including HTML views, PDF and ePub downloads, according to the available data) and Abstracts Views on Vision4Press platform.
Data correspond to usage on the plateform after 2015. The current usage metrics is available 48-96 hours after online publication and is updated daily on week days.
Initial download of the metrics may take a while.