Fig. 7
Download original image
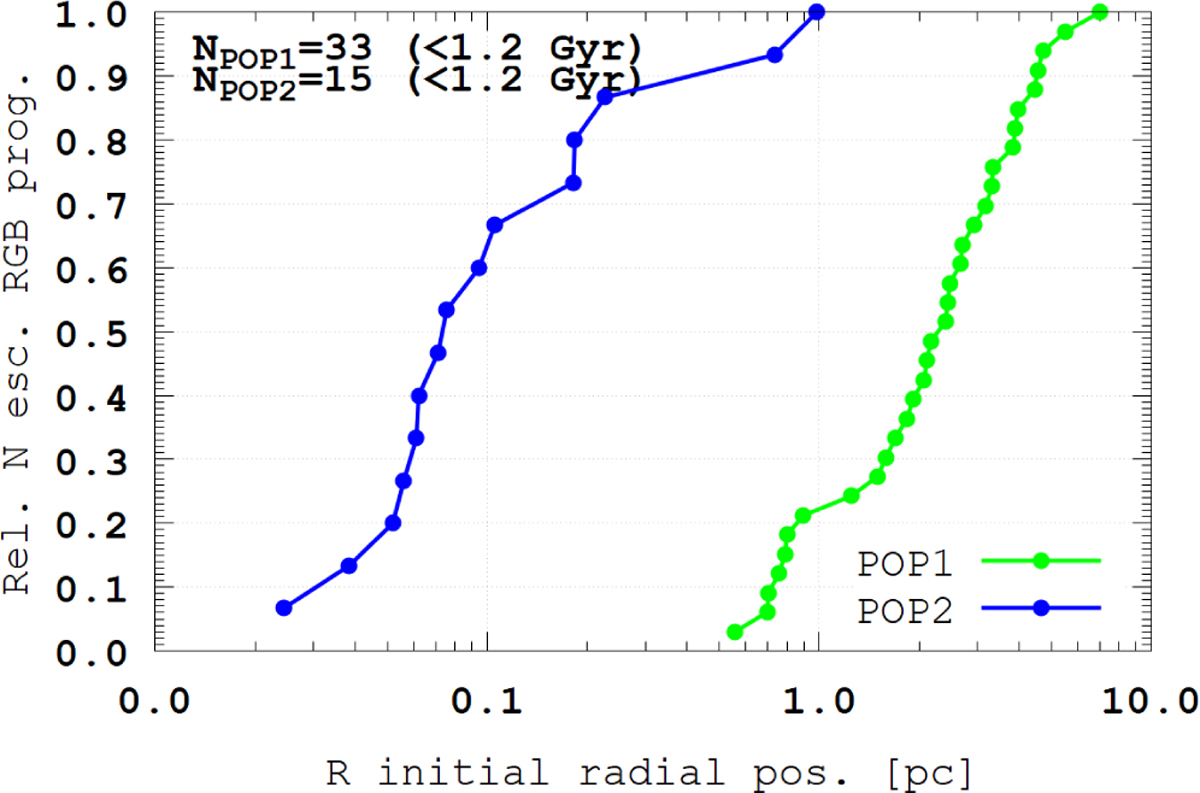
Cumulative distributions of the initial radial positions of stars with initial masses in the range 1.71–1.74 M⊙ that would have evolved into RGB stars by 1.2 Gyr but escaped the cluster prior to this time. The green curve shows 1P escapers (N = 33 out of a total of 77 such stars in the initial model), and the blue curve shows 2P escapers (N = 15 out of a total of 40). The distributions demonstrate that 2P escapers originate predominantly from the inner regions of the cluster, whereas 1P escapers are drawn from a much broader radial range. This provides direct evidence that centrally concentrated 2P RGB progenitors are preferentially removed from the central parts of the cluster.
Current usage metrics show cumulative count of Article Views (full-text article views including HTML views, PDF and ePub downloads, according to the available data) and Abstracts Views on Vision4Press platform.
Data correspond to usage on the plateform after 2015. The current usage metrics is available 48-96 hours after online publication and is updated daily on week days.
Initial download of the metrics may take a while.