| Issue |
A&A
Volume 700, August 2025
|
|
|---|---|---|
| Article Number | L18 | |
| Number of page(s) | 8 | |
| Section | Letters to the Editor | |
| DOI | https://doi.org/10.1051/0004-6361/202555498 | |
| Published online | 26 August 2025 | |
Letter to the Editor
Detection of a climate-induced increase in the lunar recession rate
Department of Meteorology and Geophysics, University of Vienna, Vienna, Austria
⋆ Corresponding author: This email address is being protected from spambots. You need JavaScript enabled to view it.
Received:
13
May
2025
Accepted:
28
July
2025
Abstract
Gravitational interplay between the Earth and Moon is believed to steadily increase the length of day (ΔLOD) and cause a secular drift of the Moon away from the Earth (lunar recession). When attempting to close the budget of the astronomically observed secular ΔLOD trend based on underlying geophysical processes, recent studies have noted an enigmatic bias (i.e., a discrepancy) of ∼0.1 milliseconds per century (ms/cy). Here we show that this bias might not arise from modeling deficiencies or uncertainties in the geophysical/astronomical data, but could be explained by plate tectonics (∼0.04 ms/cy; specifically mantle density heterogeneities and super plumes) and climate-induced variations in the rate of tidal friction (∼0.06 ms/cy). We demonstrate that the latter is consistent with independent model estimates of secular changes to the semidiurnal lunar ocean tide under climate change, induced mainly by the enhanced ocean stratification (∼0.042 ms/cy) and the mass-driven sea level rise (∼0.018 ms/cy); this in turn is caused by the melting of global glaciers and polar ice sheets (Greenland and Antarctica) and variations in land hydrology. Hence, we propose that climate change has increased the rate of tidal friction by ∼0.06 ms/cy–primarily in the post-industrial era and specifically since 1900–and has thus induced an additional lunar recession of ∼1 millimeter per year (mm/yr) on top of the background trend of ∼38.3 mm/yr. Our results bridge astronomy and climate science and have considerable implications, including for navigation in space and models of lunar and planetary ephemerides.
Key words: celestial mechanics / Earth / Moon
© The Authors 2025
 Open Access article, published by EDP Sciences, under the terms of the Creative Commons Attribution License (https://creativecommons.org/licenses/by/4.0), which permits unrestricted use, distribution, and reproduction in any medium, provided the original work is properly cited.
This article is published in open access under the Subscribe to Open model. This email address is being protected from spambots. You need JavaScript enabled to view it. to support open access publication.
1. Introduction
Under planetary dynamics, the Earth and Moon engage in gravitational interplays. By pulling the Earth toward itself, the Moon creates an equatorial bulge on the Earth. Due to the presence of oceans on the Earth’s surface, the geometry of the continents (which determines the ocean basin geometry), and the orbital velocity of the Moon being lower than rotation rate of the Earth, the Earth’s equatorial bulge rotates slightly ahead of the rest of the planet, causing the Moon to exert an additional gravitational force that pulls the bulge in the opposite direction to the Earth’s rotation. Based on the principle of the conservation of angular momentum in the Earth-Moon system, and because of the generated friction and dissipation of the Earth’s rotational energy predominantly in the oceans (and negligibly in the solid Earth), this results in a slowing of the Earth’s rotation, i.e., an increase in the length of a day (ΔLOD), and a drift of the Moon away from the Earth (termed lunar recession; see, e.g., Brosche & Sündermann 1978). Based on the most accurate estimates currently available (e.g., Williams & Boggs 2016), the ΔLOD increases by 2.4 ± 0.01 milliseconds per century (ms/cy), equivalent to a lunar recession of ∼38.3 millimeter per year (mm/yr).
Since lunar recession and the secular ΔLOD are related, one can analyze the observed ΔLOD record to gain information about planetary dynamics and the tidal friction. However, this proves to be challenging because the ΔLOD inferred from astronomical records (lunar occultations and eclipses) exhibits a secular trend that is not only considerably smaller (∼1.72 ± 0.03 ms/cy), but is furthermore complicated by the presence of superimposed millennial fluctuations with a period close to 1500 years (Morrison et al. 2021). The earliest available astronomical records date back to around 720 BC, and it is challenging to separate the mentioned millennial fluctuations from the secular trend based on only ∼2700 years of data. By extension, this implies that the secular ΔLOD trend is affected by a multitude of geophysical processes, requiring a multidisciplinary approach.
Kiani Shahvandi et al. (2024a) put forth a comprehensive framework for analyzing the secular ΔLOD trend. They show that the observed ΔLOD trend of ∼1.72 ± 0.03 ms/cy can be reconciled with the sum of the tidal friction (2.4 ± 0.01 ms/cy) and the effect of glacial isostatic adjustment (GIA; −0.8 ± 0.1 ms/cy). Although they argue that the budget of the secular ΔLOD trend is closed within the uncertainties of the utilized data, they note that the sum of the tidal friction and the GIA (∼2.4−0.8 = 1.6 ms/cy) is ∼0.1 ms/cy, lower than the observed rate (∼1.7 ms/cy). At first, it might be tempting to argue that the uncertainties in the geophysical data prohibit deeper discussions (Nakada et al. 2015) and, thus, that this bias can be perfunctorily dismissed. However, it has been noted that other geophysical processes that are usually invoked in the literature all contribute less than 0.1 ms/cy to the ΔLOD. For instance, core flows have been shown to primarily cause decadal and millennial fluctuations without exhibiting a secular trend, as confirmed in subsequent studies that examined records dating as far back as 7000 BC (Suttie et al. 2025). The secular ΔLOD trends induced by cosmic expansion (≪0.01 ms/cy), atmospheric effects (∼0.01 ms/cy; though atmospheric tides per se might induce trends as high as −0.17 ms/cy), and core-climate coupling (≪0.01 ms/cy) are negligible as well (Maeder & Gueorguiev 2021; Baenas et al. 2021; Farhat et al. 2024; Kiani Shahvandi 2025). This demonstrates that the mentioned bias might in fact be meaningful, as it is not explained by the typical geophysical candidates (see also Appendix B.3).
Precise calculations result in negligible uncertainties on the rate of tidal friction (∼0.01 ms/cy; see Williams & Boggs 2016). Furthermore, the observationally constrained GIA that is derived from the difference between climate-induced changes in the Earth’s oblateness (ΔJ2) and the accurate, satellite laser ranging (SLR)-based ΔJ2 is consistent with independent GIA estimates based on geological records (within ∼0.01 ms/cy; Caron et al. 2018). As mentioned, core flows were also shown to lack the secular component needed to close this budget. Hence, one is confronted with the perplexing situation that while the aforementioned bias may be statistically significant, its origins are unknown, since they point to geophysical processes that have hitherto been unaccounted for.
Our main aim is to first show that the aforementioned bias is meaningful and then attempt to find its origin. As such, we delve into both theory and observations of Earth’s rotation and suggest a possible resolution. In the following we present the main results; the methodology and data are detailed in the appendices.
2. Results
2.1. Finding the origin of the bias
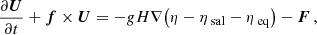
In Fig. 1 we summarize the aforementioned enigmatic bias and its resolution. The bias of ∼0.1 ms/cy could be explained based on two processes: plate tectonics (∼0.04 ms/cy; see Greff-Lefftz 2011, specifically, density heterogeneities and super plumes) and variations in the rate of tidal friction (∼0.06 ms/cy). Despite evidence of the effect of plate tectonics on the ΔLOD (Greff-Lefftz 2011), studies that have attempted to analyze the secular ΔLOD trend have generally ignored its contribution. Here, however, we demonstrate that the currently available astronomical/geophysical observations enable the detection of the rather small contribution of plate tectonics to the ΔLOD. Although plate tectonics are relevant, other impacts induced by mantle dynamics (such as that of convective cells) are negligible. Thus, the origin of the rest of the bias should be sought in the Earth’s superficial fluids.
 |
Fig. 1. (a) Explanation for the enigmatic bias (+0.1 ms/cy) that arises when closing the budget of the secular ΔLOD trend based on the sum of tidal friction (+2.4 ± 0.01 ms/cy) and GIA (−0.8 ± 0.1 ms/cy). (b) Origin of the bias determined by accounting for plate tectonics (+0.04 ± 0.02 ms/cy) and changes in the rate of tidal friction under climate change (+0.06 ± 0.01 ms/cy; see Appendix B.3). The shaded gray area shows the range of independent estimates of possible changes in the rate of tidal friction (0.024–0.12 ms/cy), computed based on tidal models (which include the effects of stratification and sea level rise; Appendix A.3). |
It has thus far been assumed that on timescales of a few decades to a few centuries, the rate of tidal friction (denoted  ) is constant. This rate varies on geological timescales as the result of plate tectonics that modify the geometry of the continents and ocean basins, thereby changing the tides and the amount of tidal dissipation in the oceans (Huang et al. 2024). The relevant tidal constituents here are primarily M2 (i.e., the semidiurnal lunar ocean tide) and, to a lesser degree, O1 and N2 (e.g., Maeder & Gueorguiev 2021). Efforts have been made to quantify the secular changes in M2 by analyzing the variations in sea levels (Schindelegger et al. 2018), as well as ocean stratification (Opel et al. 2024; Gong et al. 2025). Utilizing tidal models and taking the observed rates of stratification and the sea level change into account, it has been demonstrated that M2 is changing by around 1–5% per century (e.g., Schindelegger et al. 2018). This is equivalent to changes in the rate of tidal friction of 0.024–0.12 ms/cy. In Fig. 1 we compare this range with our inferred value of 0.06 ms/cy for the change in the rate of tidal friction. As seen, these estimates are consistent, although our observationally constrained value is placed at the middle to lower bounds of the estimations based on tidal models, which might be due to a bias in the calculations of tidal models that use altimetry observations (e.g., Ray & Schindelegger 2025).
We thus suggest that the mentioned bias (Sect. 1) is resolved by considering the effect of plate tectonics and changes in the rate of tidal friction. The latter is caused mainly by changes in the ocean stratification (connected to climate modes such as Pacific decadal oscillation; Opel et al. 2024) and, to a lesser degree, by sea level rise driven mainly by present-day climate change. For the latter, we note that while sea level rise is in part due to the effect of thermal expansion and GIA, it is increasingly dominated by the melting of polar ice sheets and global glaciers and shifts in terrestrial water storage (Frederikse et al. 2020). With the projected acceleration in sea level rise in the 21st century, the rate of tidal friction might increase more rapidly (close to the upper bound of 5% per century). In this case, analysis of the secular ΔLOD trend becomes increasingly more challenging since both the effect of barystatic processes and the change in the rate of tidal friction need to be taken into account, with the latter being considerably difficult to quantify. It should also be mentioned that the climate-induced changes in the rate of tidal friction is a secondary impact of mass-driven sea level rise, because barystatic processes themselves influence the ΔLOD by inducing quasi-decadal variations and trends, particularly since the advent of the industrial era (Kiani Shahvandi et al. 2024b). However, we have demonstrated for the first time that barystatic processes affect the Earth’s tides, thereby affecting tidal friction and the Earth-Moon distance.
We also analyzed the effect of changes in the other tidal constituents (e.g., S2, K1, and O1) on the  and
and  (i.e., the lunar recession rate). Our results show that these impacts are much less significant (∼13% that of M2), in agreement with the notion that the most important constituent for the tidal friction is M2 (Green et al. 2017).
2.2. Discussions
The changes in the rate of tidal friction as a result of variations in the M2 tide affect the Earth-Moon dynamics (as mentioned in Sect. 2.1, the effect of other tidal constituents is much less significant). Using Eq. (A.3), we estimated the equivalent changes in the Earth-Moon distance (Table 1). As seen, an increase of 0.06 ms/cy in the  equates to a ∼1 mm/yr change in
  .
.
As noted, variations in the  are caused by both the enhanced ocean stratification and barystatic processes. It is challenging to separate these effects because barystatic processes potentially alter ocean stratification. Notwithstanding, by paying attention to this caveat, we attempted to divide the variations in the
  into their individual components (Table 1). As one can see, around 70% of the change is caused by enhanced stratification of the oceans and 30% by barystatic processes. Among the individual barystatic processes, the effect of the melting of the polar ice sheet and global glaciers is dominant, while that of terrestrial water storage is negligible.
Climate-induced variations in the rate of tidal friction,  , and the Earth-Moon distance,
  .
.
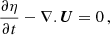
In addition, we attempted to calculate the time-dependent changes in the  in the range 1900–2100 and based on two climate change scenarios, namely RCP2.6 and RCP8.5, which represent roughly the lower and upper bounds of greenhouse gas emissions (for a thorough discussion on the data, the reader is referred to Kiani Shahvandi & Soja 2025). Following the approach outlined in Appendix A.3, we calculated the results, which are displayed in Fig. 2. As can be understood from this figure, the changes in the
  range from ∼0.029 ms/cy to ∼0.11 ms/cy, equivalent to a change in the
  on the order of ∼0.46–1.76 mm/yr. In addition, using Eq. (A.4), these are equivalent to a ΔΨ in the range 0.04–0.56 TW. Note, however, that by 2100 the variations in the
  and
and  are ∼1.62 times bigger under RCP8.5 compared to RCP2.6. This implies that the changes in the Earth-Moon dynamics under climate change are small, even in the case of extremely high greenhouse gas emissions. Note also that prior to the industrial era, the change in the rate of tidal friction was most likely much less than 2.5%, although during the last glacial cycle it might have been considerably larger (e.g., Wilmes et al. 2023).
 |
Fig. 2. Changes in the rate of tidal friction ( |


Similar to previous studies (e.g., Egbert & Ray 2000), we find evidence for dissipation in both shallow (H < 1000 m; Eq. (A.5)) and deep oceans (H > 1000 m). Our results show that most of the dissipation (∼73%) occurs in shallow oceans. However, a substantial portion (∼27%) is also generated in the deep oceans. The aforementioned barystatic processes, for instance, mostly contribute to dissipation in shallow oceans (Schindelegger et al. 2018).
2.3. Implications
Our results have considerable implications. For one, we have closed the budget of the observed secular ΔLOD trend based on tidal friction and its variations, GIA, and plate tectonics. Doing so, we have determined the origin of the bias mentioned in Sect. 1. We have also revised and improved upon previous studies that suggested explanations to Munk’s enigma of sea level rise (e.g., Mitrovica et al. 2015). Our results are consistent with sea level rises since 1900, SLR-based ΔJ2, GIA statistics, core flow models, and mantle dynamics. Therefore, we are confident in the theory and observations of global geophysics.
Another implication is that even though the quantified variations are small, they are capable of affecting ΔLOD predictions. As discussed in various studies (e.g., Gross 2015), the prediction of Earth rotation parameters, including the ΔLOD, is important for a host of applications, such as spacecraft navigation and the orientation of deep-space telescopes. Changes in the  reduce the long-range predictability of the ΔLOD (large errors of up to 1 ms), which in turn reduces the accuracy of transformation between terrestrial and celestial frames (errors of tens of meters to a few kilometers, depending on the satellite-Earth distance and orbital configurations; e.g., Kiani Shahvandi et al. 2023). To ensure an accurate transformation, enhancing our understanding of the underlying geophysical processes that affect the ΔLOD is necessary. Hence, monitoring changes in the
  under climate change might prove an increasingly important task.
Finally, we note that even though the models of lunar and planetary ephemerides are accurate (e.g., DE440 and DE441 from Park et al. 2021), they are essentially incomplete. They consider the effect of lunar recession by adopting dissipation models (Williams & Boggs 2016). However, they do not take the effects of climate dynamics, for example the sea level rise, into account. Our results imply that these models need to be revised to better reflect the Earth’s dynamics.
3. Conclusions and outlook
When analyzing the ΔLOD on decadal and centennial timescales, studies have hitherto assumed that the rate of tidal friction is constant. However, when closing the secular budget of the astronomically observed ΔLOD, an enigmatic bias emerged, which had been superficially attributed to the data/modeling uncertainty. Here we argue that this bias should not be perfunctorily dismissed, because we can propose an alternative explanation for its origin: that the influence of plate tectonics needs to be considered and, more importantly, that under present-day climate change the rate of tidal friction is not constant. We estimate that tidal friction has increased by around +0.06 ms/cy compared to its long-term value of +2.4 ms/cy, an increase of nearly 2.5%. This estimate is in agreement with the independent outputs of tidal models and observed trends of M2 in recent decades (e.g., Zhao 2023). The primary causes of these changes are variations in ocean stratification (0.042 ms/cy) and, to a lesser degree, mass-driven sea level rise (0.018 ms/cy).
Since under planetary dynamics the tidal friction and the Earth-Moon distance are related, our estimate equates to an approximate increase of ∼1 mm/yr in the rate of lunar recession. We estimate that from the onset of the industrial era, and particularly since the beginning of the 21st century, the mentioned changes might have accelerated and may potentially reach values of 0.11 ms/cy and 1.76 mm/yr by the end of the 21st century under RCP8.5 climate scenario.
Our results provide additional insights into the Earth-Moon dynamics and demonstrate that enhancing our understanding of the causes of the ΔLOD is essential. As a rotational parameter of the Earth, the ΔLOD is used in the transformation between terrestrial and celestial frames, which is needed for applications such as navigation in space. To keep this transformation precise, we need to monitor the causes of the ΔLOD and design prediction strategies that take this additional knowledge into account. However, since the quantified impacts of changes in the Earth-Moon distance are at the level of uncertainty of the lunar laser ranging observations (1–1.7 mm; see, e.g., Colmenares et al. 2023), it is still challenging to observe these effects in the planetary ephemerides (e.g., Park et al. 2021). A more elaborate lunar recession model is needed for this purpose.
See the scripts on https://zenodo.org/records/10844368.
The data can be downloaded from https://download.csr.utexas.edu/pub/slr/degree_2.
The mean and standard deviation of these estimates can be accessed via https://doi.org/10.5281/zenodo.3862995.
Acknowledgments
This research was performed during postdoctoral studies of M.K.S. funded by Swiss National Science Foundation (grant no. P500PN_225601).
References
- Auclair-Desrotour, P., Mathis, S., Laskar, J., & Leconte, J. 2018, A&A, 615, A23 [EDP Sciences] [Google Scholar]
- Baenas, T., Escapa, A., & Ferrándiz, J. M. 2021, A&A, 648, A89 [NASA ADS] [CrossRef] [EDP Sciences] [Google Scholar]
- Brosche, P., & Sündermann, J. 1978, Tidal friction and the Earth’s rotation (Berlin, Heidelberg: Springer) [Google Scholar]
- Caron, L., Ivins, E. R., Larour, E., et al. 2018, Geophys. Res. Lett., 45, 2203 [Google Scholar]
- Chao, B. F. 2024, Surveys Geophys., 46, 71 [Google Scholar]
- Chen, J., Tapley, B., Seo, K.-W., Wilson, C., & Ries, J. 2019, Geophys. Res. Lett., 46, 13984 [Google Scholar]
- Cheng, M., Tapley, B. D., & Ries, J. C. 2013, J. Geophys. Res. Solid Earth, 118, 740 [Google Scholar]
- Colmenares, N. R., Battat, J. B. R., Gonzales, D. P., Murphy, T. W., & Sabhlok, S. 2023, PASP, 135, 104503 [Google Scholar]
- Dumberry, M., & Mandea, M. 2022, Surveys Geophys., 43, 5 [Google Scholar]
- Egbert, G. D., & Ray, R. D. 2000, Nature, 405, 775 [NASA ADS] [CrossRef] [Google Scholar]
- Egbert, G. D., Bennett, A. F., & Foreman, M. G. G. 1994, J. Geophys. Res. Oceans, 99, 24821 [CrossRef] [Google Scholar]
- Einšpigel, D., & Martinec, Z. 2015, Ocean Modell., 92, 85 [Google Scholar]
- Farhat, M., Auclair-Desrotour, P., Boué, G., Deitrick, R., & Laskar, J. 2024, A&A, 684, A49 [NASA ADS] [CrossRef] [EDP Sciences] [Google Scholar]
- Frederikse, T., Landerer, F., Caron, L., et al. 2020, Nature, 584, 393 [CrossRef] [PubMed] [Google Scholar]
- Gillet, N., Dumberry, M., & Rosat, S. 2021, Geophys. J. Int., 224, 216 [Google Scholar]
- Gong, Y., Chen, Z., Xu, J., et al. 2025, Sci. Adv., 1, eadq4577 [Google Scholar]
- Green, J. A. M., & Huber, M. 2013, Geophys. Res. Lett., 40, 2707 [NASA ADS] [CrossRef] [Google Scholar]
- Green, J. A. M., Huber, M., Waltham, D., Buzan, J., & Wells, M. 2017, Earth Planet. Sci. Lett., 461, 46 [CrossRef] [Google Scholar]
- Greff-Lefftz, M. 2011, Geophys. J. Int., 187, 595 [Google Scholar]
- Gross, R. S. 2015, Treatise Geophys., 3, 215 [Google Scholar]
- Haigh, I. D., Pickering, M. D., Green, J. A. M., et al. 2020, Rev. Geophys., 58, e2018RG000636 [Google Scholar]
- Huang, H., Ma, C., Laskar, J., et al. 2024, Proc. Nat. Acad. Sci., 121, e2317051121 [Google Scholar]
- Kendall, R. A., Mitrovica, J. X., & Milne, G. A. 2005, Geophys. J. Int., 161, 679 [Google Scholar]
- Kiani Shahvandi, M. 2025, Phys. Earth Planet. Interiors, 364, 107366 [Google Scholar]
- Kiani Shahvandi, M., & Soja, B. 2025, Geophys. Res. Lett., 52, e2024GL113405 [Google Scholar]
- Kiani Shahvandi, M., Dill, R., Dobslaw, H., et al. 2023, J. Geophys. Res. Solid Earth, 128, e2023JB026720 [Google Scholar]
- Kiani Shahvandi, M., Adhikari, S., Dumberry, M., Mishra, S., & Soja, B. 2024a, Proc. Nat. Acad. Sci., 121, e2406930121 [Google Scholar]
- Kiani Shahvandi, M., Noir, J., Mishra, S., & Soja, B. 2024b, Geophys. Res. Lett., 51, e2024GL111148 [Google Scholar]
- Loomis, B. D., Sabaka, T. J., Rachlin, K. E., et al. 2025, Geophys. Res. Lett., 52, e2024GL114472 [Google Scholar]
- Maeder, A. M., & Gueorguiev, V. G. 2021, Astrophys. Space Sci., 366, 101 [Google Scholar]
- Mathews, P. M., & Lambert, S. B. 2009, A&A, 493, A49 [Google Scholar]
- Milne, G. A., Gehrels, W. R., Hughes, C. W., & Tamisiea, M. E. 2009, Nat. Geosci., 2, 471 [Google Scholar]
- Mitrovica, J. X., Hay, C. C., Morrow, E., et al. 2015, Sci. Adv., 1, e1500679 [Google Scholar]
- Morrison, L. V., Stephenson, F. R., Hohenkerk, C. Y., & Zawilski, M. 2021, Philos. Trans. R. Soc. A, 477, 20200776 [Google Scholar]
- Nakada, M., Okuno, J., Lambeck, K., & Purcell, A. 2015, Geophys. J. Int., 202, 976 [Google Scholar]
- Opel, L., Schindelegger, M., & Ray, R. D. 2024, Commun. Earth Environ., 5, 261 [Google Scholar]
- Paek, H., & Huang, H.-P. 2013, J. Clim., 26, 3846 [Google Scholar]
- Park, R. S., Folkner, W. M., Williams, J. G., & Boggs, D. H. 2021, AJ, 161, 105 [NASA ADS] [CrossRef] [Google Scholar]
- Ray, R. D., & Schindelegger, M. 2025, J. Geodesy, 99, 11 [Google Scholar]
- Schindelegger, M., Green, J. A. M., Wilmes, S.-B., & Haigh, I. D. 2018, J. Geophys. Res. Oceans, 123, 4593 [Google Scholar]
- Steinberger, B. 2016, Geophys. J. Int., 205, 604 [Google Scholar]
- Stephenson, F. R., & Morrison, L. V. 1984, Philos. Trans. R. Soc. A, 313, 47 [Google Scholar]
- Stephenson, F. R., Morrison, L. V., & Smith, F. 1995, Philos. Trans. R. Soc. A, 351, 165 [Google Scholar]
- Stephenson, F. R., Morrison, L. V., & Hohenkerk, C. Y. 2016, Philos. Trans. R. Soc. A, 472, 2196 [Google Scholar]
- Suttie, N., Nilsson, A., Gillet, N., & Dumberry, M. 2025, Earth Planet. Sci. Lett., 652, 119185 [Google Scholar]
- Williams, J. G., & Boggs, D. H. 2016, Celestial Mech. Dyn. Astron., 126, 89 [NASA ADS] [CrossRef] [Google Scholar]
- Wilmes, S.-B., Pedersen, V. K., Schindelegger, M., & Green, J. A. M. 2023, Paleooceanograp. Paleoclimatol., 38, e2023PA004727 [Google Scholar]
- Zhao, Z. 2023, Geophys. Res. Lett., 50, e2023GL105764 [Google Scholar]
Appendix A: Methodology
A.1. ΔLOD and ΔJ2
In the analyses presented in this Letter, both the models and the observations of Earth’s rotation as well as related global parameters of the Earth (particularly ΔJ2) are used. Therefore, following Chao (2024), we present the relationship between the ΔLOD (in milliseconds: ms) and ΔJ2 (dimensionless) as
 (A.1)
(A.1)
or equivalently
 (A.2)
(A.2)
where T0 = 8.64 × 10⁷ is the nominal duration of a day in ms, C⊕ = 8.0345 × 1037 kg m2 is the Earth’s polar moment of inertia, R⊕ = 6.378 × 10⁶ is the Earth’s radius in meters, M⊕ = 5.972 × 1024 kg is the mass of the Earth, ΔT⊕ is the effect of changes in the trace of the Earth’s tensor of inertia, and β represents the extent of core-mantle coupling (β = 0.89 and β = 1 for, respectively, the fully decoupled and fully coupled core and mantle). It is important to note that Eqs. (A.1) and (A.2) are based on the degree 2 spherical harmonic expansion of the Earth’s gravitational field. However, insofar as ΔLOD is concerned, the effect of higher order spherical harmonics (3 and above) is negligible (e.g., Chao 2024).
Kiani Shahvandi et al. (2024a) presented extensive numerical results and discussions to demonstrate that the influence of ΔT⊕ is negligible and it can thus be ignored, a conclusion followed in our analyses (i.e., we set ΔT⊕ = 0). However, the results presented in Kiani Shahvandi et al. (2024a) are based on the full core-mantle coupling (β = 1). Given this caveat, one potential source of the aforementioned bias might be the influence of core-mantle coupling represented as the parameter β in Eq. (A.1). We note, however, that the ΔLOD in Eq. (A.1) exclusively contains its mass component and not the motion term. A ΔLOD caused by core flows is primarily a motion term and the influence of mass term is at least an order of magnitude smaller than the observed variations in ΔJ2 (e.g., Gillet et al. 2021; Dumberry & Mandea 2022). Hence, the role of core flows is almost certainly negligible, as demonstrated by recent studies (e.g., Kiani Shahvandi et al. 2024b). A similar argument can be put forth to demonstrate the negligible influence of atmospheric angular momentum on the secular ΔLOD trend (Paek & Huang 2013), necessitating the search for other processes to explain the aforementioned bias in Sect. 1.
A.2. ΔLOD and the Earth-Moon distance
The secular change in ΔLOD is dominated by the effect of lunar tidal friction (denoted  ). Hence, there exists a simplified relationship between
  (in ms/cy) and changes in the Earth-Moon distance (denoted by
  , in mm/yr), as follows (see, e.g., Maeder & Gueorguiev 2021):
 (A.3)
(A.3)
Equation (A.3) is an approximation to a more complex formula based on the orbital parameters (see, e.g., Eq. (30) in Williams & Boggs 2016). For the problem under consideration—where small variations in  are analyzed—the error induced by the approximation in Eq. (A.3) is too negligible (we compared the results based on both the approximated and full formulas, revealing a difference of ≪0.03 mm/yr for deriving
  , which is in agreement with Maeder & Gueorguiev 2021).
It is also important to note that Eq. (A.3) is only for the Earth-Moon dynamics. Therefore, changes in ΔLOD that are caused by other geophysical processes do not affect the Earth-Moon distance. Any non-astronomical process that is to affect the Earth-Moon dynamics needs to change the rate of tidal friction, which occurs when the dynamics of the Earth’s tides change and the amount of tidal dissipation is altered (Haigh et al. 2020).
A.3. The Earth-Moon distance and tidal dissipation
In addition to inferring the changes in  from the observed ΔLOD record, we perform independent calculations by deriving the changes in tidal dissipation (ΔΨ), using the methodology presented in Green et al. (2017) and taking the present-day climatic impacts into account (specifically, changes in the ocean stratification and sea level rise). We then calculated
  using the following equations:
 (A.4a)
 (A.4b)
 (A.4c)
in which M☾ = 7.346 × 10²² kg is the mass of the Moon,  the present-day Earth-Moon distance, Ω⊕ = 7.292115 × 10⁻⁵ rad sec−1 the mean rotation rate of the Earth, and G = 6.67430 × 10⁻¹¹ m3 kg−1sec−2 the gravitational constant. Note that to transfer
  to the unit of mm/yr, we multiply by the coefficient 3.15576 × 10¹⁰.
We derive the value of ΔΨ itself by using the Laplace equation (see, e.g., Egbert et al. 1994), in which we solve the shallow water equations in geophysical fluid dynamics:
 (A.5a)
 (A.5b)
in which U = uH (where u is the velocity and H the depth), f the Coriolis term (note that this term is sometimes considered the primary effect of changes in tide, which is connected to change in the rotational velocity of the Earth; see, e.g., Auclair-Desrotour et al. 2018), g = 9.81 m/s2, F the dissipative term (containing the effects of bed friction and tidal conversion, Green & Huber 2013), ∇ and ∇. the gradient and divergence operators, respectively, and η, ηsal, and ηeq respectively the tidal, self-attraction and loading, and equilibrium elevations. Subsequently, we calculated ΔΨ as follows:
 (A.6a)
 (A.6b)
 (A.6c)
where ρ is the water density, and the overline implies a time average. It is important to note that this time averaging is performed when analyzing the changes in tidal friction over geological timescales, whereby the potential impact of climatic oscillations is averaged out. However, for our problem we are interested in time-dependent changes in tidal friction and therefore, no averaging is needed. The effect of sea level rise (ηslr) and ocean stratification (ηos) is included in tidal elevation (i.e., ηslr + ηos) and as such, variations in the ΔΨ can be determined by comparing against the case where no climatic effects are included.
We solve the equations in Eq. (A.5) and (A.6) following the standard numerical methods (Green et al. 2017; Schindelegger et al. 2018; Opel et al. 2024). Specifically, we
-
used the available softwares for simulations, particularly OTIS (Egbert et al. 1994) and DEBOT (Einšpigel & Martinec 2015),
-
used a drag coefficient of 0.003 (recommended by Green et al. 2017),
-
took buoyancy frequency at sea bed from coupled climate models (the differences across climate models have only a negligible impact on the derived tidal dissipation),
-
utilized a 0.25° ×0.25° bathymetry as described in Green et al. (2017),
-
considered the sea level rise dataset of Frederikse et al. (2020) and their projections up to 2100 as presented in Kiani Shahvandi et al. (2024a), and followed the approach of Schindelegger et al. (2018) to incorporate the barystatic effects on tides,
-
and followed Opel et al. (2024) to incorporate the effect of stratification into the model1.
A.4. The analysis approach
We mainly use the estimates of previous studies and reconcile them to provide an explanation for the mentioned bias (Sect. 1). However, for the analysis of core-mantle coupling, we use Eq. (A.1) in conjunction with the observed ΔJ2, as well as observed and modeled barystatic processes from Frederikse et al. (2020). These barystatic data present the mass redistribution across the continents and the oceans, and include the effect of melting of polar ice sheets, global glaciers, and shifts in the terrestrial water storage. Our approach is identical to that of Kiani Shahvandi et al. (2024a), where the goal is to derive GIA in the following steps:
-
Calculating the climate-induced ΔLOD from the mentioned barystatic dataset and by using the methodology of sea level equation (Kendall et al. 2005).
-
Transferring the derived ΔLOD to the equivalent oblateness variations (
 ) using Eq. (A.2).
 -
Forming the residual series
 (i.e., subtraction of the effect of barystatic processes from the observed oblateness variations from SLR2).
 -
Fitting a line to the mentioned residuals and analyzing the sensitivity of the slope of this line to the parameter β in Eq. (A.2).
-
Transferring the derived GIA rate back to the ΔLOD domain using Eq. (A.1).
In mathematical terms, after deriving ΔLOD based on barystatic datasets:
 (A.7a)
 (A.7b)
 (A.7c)
 (A.7d)
where a0 and  are the parameters of the line that is fitted to
  (in the time domain, t), of which
  is the important one and represents the rate of GIA (in ms/cy).
The steps mentioned above are used to derive the GIA-driven secular ΔLOD, which is then used for the analysis of closing the budget of the observed secular ΔLOD trend. Note that as mentioned in Appendix A.3, we also perform calculations based on tidal dissipation to independently verify our conclusions.
Appendix B: Data and models
B.1. Discussion
Here we discuss the possible role of the utilized models and data in causing the aforementioned bias (Sect. 1).
We used three models in our analyses, namely, the relationship between ΔLOD and ΔJ2 in Eq. (A.1), the connection between  and
and  as in Eq. (A.3), and the sea level equation (note that Eq. (A.4) is used when calculating an independent estimate for the changes in
  , but is not directly used for the budget closure of the ΔLOD). As discussed in Appendices A.1 and A.2, the first two induce no meaningful errors for the problem under consideration. In addition, sea level equation is a mathematically precise formulation of mass-driven sea level change caused by barystatic processes (Kendall et al. 2005). Note also that the calculations of sea level equation used here are performed on an elastically-compressible rotating Earth, thus no bias is introduced due to the adoption of various possible choices for the mantle viscosity parameters (Mitrovica et al. 2015). It should also be mentioned that the constants used in these relations (such as C⊕, M⊕, and R⊕ in Eq. (A.1), among others) are taken as their standard, widely accepted values and they do not introduce a bias.
Next, we discuss the effect of the three types of data that we utilized, namely the astronomically determined ΔLOD, barystatic processes, and the SLR-based ΔJ2. The ΔLOD that is derived from lunar occultation and eclipse records in the range 720 BC to 2020 AD is used to calculate the observed secular ΔLOD trend. Morrison et al. (2021) presented a value of 1.72±0.03 ms/cy, but it has been subject to revisions throughout the years (ranging between ∼1.4 ms/cy and ∼1.78 ms/cy, Stephenson & Morrison 1984; Stephenson et al. 2016), as more comprehensive astronomical records have become available. Based on the most comprehensive records of lunar occultations and eclipses (Morrison et al. 2021), and taking into account the uncertainties associated with these data (Stephenson et al. 1995) and the challenges in separating the secular ΔLOD trend from millennial fluctuations, a value of ∼1.7 ms/cy is the most accurate estimate (Suttie et al. 2025), on which we base our calculations. As Morrison et al. (2021) discuss, there are currently no other historical records available that could be used to calculate the ΔLOD, implying that the mentioned rate is robust (within the uncertainty bounds of ∼0.03 ms/cy) and unlikely to be modified should new records emerge.
The barystatic data used in our calculations explain the sea level rise since 1900. As discussed in Frederikse et al. (2020), various strategies (such as removing the effect of local sea level change and vertical land motion) are used to avoid introducing a bias in the sea level reconstructions (which were major factors in causing biases reported in earlier studies, Milne et al. 2009). Extensive discussions in Kiani Shahvandi et al. (2024a) demonstrate that a bias of ∼0.1 ms/cy in the ΔLOD potentially equates to a bias of a few mm/yr in global sea level change, which prohibits the accurate closure of the sea level budget. Hence, the secular ΔLOD budget misclosure does not originate in the utilized barystatic data.
Since GIA impacts are extracted from the SLR-based ΔJ2 after the removal of barystatic effects, a bias might be introduced should the SLR data contain biases. Although based on the discussions in various studies (see, e.g., Cheng et al. 2013; Chen et al. 2019) there might be a bias in the other components of the Earth’s gravitational field (including degree 0 and 1), the SLR-based ΔJ2 does not exhibit a bias (see, e.g., Loomis et al. 2025). We further examine this by experimenting with Eq. (A.1): we derived GIA by analyzing the sensitivity of the derived rate to the extent of core-mantle coupling. The results are summarized in Table B.1.
Sensitivity of the derived GIA rate to the extent of core-mantle coupling (β).
The results above show that not only is the GIA rate (almost) independent of the extent of core-mantle coupling (a difference of ∼0.003 ms/cy; the reason being the derived GIA is observationally constrained to ΔJ2; Eqs. (A.7)), but they also demonstrate that the SLR-based ΔJ2 contains no bias that would impact the derived GIA. Furthermore, as discussed before, the derived GIA impact is fully consistent with independent estimates based on geological records since the last glacial maximum and constrained with present-day crustal uplifts derived from global navigation satellite system (Caron et al. 2018).
B.2. Some additional notes on atmospheric effects
As mentioned in Sect. 1, the total atmospheric effects are rather negligible (cumulative of pressure and zonal wind strength variations, as well as atmospheric tides). However, some individual atmospheric contributors might contribute considerably to the secular ΔLOD. For instance, atmospheric tides might induce secular trends as large as −0.10 to −0.17 ms/cy (Mathews & Lambert 2009; Farhat et al. 2024). Interestingly enough, if this effect is considered per se, the mismatch between the observed (∼1.72 ms/cy) and modeled (∼1.43 ms/cy) secular ΔLOD trend is further widened (compared to the value of ∼1.6 before for the modeled value), and the need for a geophysical process that increases the ΔLOD becomes more pronounced. This is because in this case the mismatch exceeds one standard deviation and therefore, it might be even more reasonable to attempt searching for other geophysical processes.
B.3. Some notes on the uncertainties of geophysical estimates and potential shortcomings of the study
In Table B.2 we summarize the uncertainties of the geophysical processes involved in our analysis. Based on this table, a few notes are warranted.
First, we quantified the uncertainty of the change in tidal friction using 100 ensemble members of barystatic processes, which represent spread of the possible values of climate estimates as is typical of climate studies3. Calculating the mean and standard deviation across these ensembles results in values of 0.06 and 0.01 ms/cy for the mean and uncertainty, respectively (in other words, for each of the aforementioned ensemble members the methodology in Appendix A.3 is applied and the corresponding  is derived). It is crucial to mention that this uncertainty is different from the possible range of change in the
  (0.024–0.12 ms/cy) shown in Fig. 1, because the latter shows the lower and upper bounds of possible changes.
Second, the effect of core dynamics (specifically, core flows at the top of the Earth’s core) is dependent on the adopted mathematical model (such as tangential geostrophy, magneto-Archimedes-Coriolis, among others in magnetohydrodynamics) and geomagnetic field model (modern, archaeomagnetic, and paleomagnetic). Earlier studies suggested a considerable secular trend caused by core flows (e.g., around 0.4–0.6 ms/cy Mitrovica et al. 2015, as an ingredient to the resolution of the Munk’s enigma of sea level rise). However, using improved models and data, recent studies have suggested that core flows do not induce secular trends as large as one believed (Kiani Shahvandi et al. 2024b), and the uncertainty of this estimate is probably much smaller than 0.1 ms/cy (e.g., Suttie et al. 2025). However, a small residual trend from core dynamics cannot be excluded, the assessment of which requires further future advancements in the field of core dynamics.
Third, the atmospheric contribution also depends on the adopted model (in this case, climate models and scenarios). We suggest that the cumulative effect of atmospheric contributions (thermal tides and zonal wind strength and pressure variations) is limited to 0.01 ms/cy. However, this might depend the magnitude of the effect of zonal winds and pressure variations, which shows a significant spread across the output of different climate models and could range from nearly zero to more than +1.5 ms/cy (for a review on this topic the reader is referred to Gross 2015). Despite this and as discussed in Gross (2015), basic knowledge on atmospheric dynamics delineate the fact that the overall contribution of atmosphere to the long-period ΔLOD (decadal and longer) is limited. This is further corroborated by the fact that atmosphere mainly affects the ΔLOD through exchange of motion term of angular momentum with the mantle, and constraints from mantle rotation (e.g., ΔJ2 and drift of the universal time from atomic clocks, a quantity known as UT1-UTC) reveal that on secular timescales the solid Earth processes dominate the ΔLOD (Gross 2015). As such, the uncertainty of atmospheric contributions is probably smaller than 0.1 ms/cy.
Fourth, we used the estimates of Greff-Lefftz (2011) for plate tectonics (mantle density heterogeneities and super plumes). However, in order to derive the uncertainty of this estimate, we used an ensemble of 305 secular ΔLOD caused by plate tectonics (see Steinberger 2016, and references therein for how these ensembles are derived). These ensembles are based on the spread and statistics of 105 measurements of 10 Myr rates, 105 values of 2 Myr rates, 13 values of 1 Myr rates, and 83 values of 0.01 Myr rates. Based on the spread of these estimates, we derived a value of 0.02 ms/cy as the uncertainty of plate tectonics, as well as corroborating the 0.04 ms/cy estimate for the magnitude of plate tectonics proposed by Greff-Lefftz (2011).
Finally, it should also be acknowledged that although we suggested that changes in the tidal friction are caused by sea level change and ocean stratification, alternative mechanisms might also be possible. One such mechanism might be the changes in ocean circulation, the effect of which could be analyzed in future studies and compared with that of sea level change and ocean stratification.
Uncertainty of different geophysical processes involved in the analysis presented in this Letter.
Appendix C: Cumulative changes in time and the lunar orbit
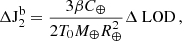
In Fig. C.1 we analyze the total changes in the rate of tidal friction and the associated variations in the Earth-Moon distance. These changes range from around ∼0.024 to ∼11.6 ms for  , equivalent to changes in the range 0.38–184.9 mm for
  . These imply that one can expect up to ∼184.9 mm changes in the semi-major axis of Moon’s orbit under RCP8.5 at the end of the 21st century (and ∼165.2 mm under RCP2.6). The current values are
  =5.2 ms and
  =82.7 mm.
The mentioned changes in  in the 20th and 21st centuries are rather small compared to the cumulative changes of ∼7698.3 mm caused by the background tidal friction rate of 2.4 ms/cy (at the end of 21st century). Detecting these in lunar and planetary ephemerides (e.g., DE440 and DE441 of Park et al. 2021) is currently not possible, due to data and modeling uncertainties, as well as the dynamic model used to generate these ephemerides that do not account for climate effects. However, our results demonstrate that for accurate lunar and planetary ephemerides the climatic effects might need to be considered, a topic for future studies.
 |
Fig. C.1. Cumulative changes in the rate of tidal friction ( |


All Tables
Climate-induced variations in the rate of tidal friction, , and the Earth-Moon distance, .
Sensitivity of the derived GIA rate to the extent of core-mantle coupling (β).
Uncertainty of different geophysical processes involved in the analysis presented in this Letter.
All Figures
|
Fig. 1. (a) Explanation for the enigmatic bias (+0.1 ms/cy) that arises when closing the budget of the secular ΔLOD trend based on the sum of tidal friction (+2.4 ± 0.01 ms/cy) and GIA (−0.8 ± 0.1 ms/cy). (b) Origin of the bias determined by accounting for plate tectonics (+0.04 ± 0.02 ms/cy) and changes in the rate of tidal friction under climate change (+0.06 ± 0.01 ms/cy; see Appendix B.3). The shaded gray area shows the range of independent estimates of possible changes in the rate of tidal friction (0.024–0.12 ms/cy), computed based on tidal models (which include the effects of stratification and sea level rise; Appendix A.3). |
| In the text | |
|
Fig. 2. Changes in the rate of tidal friction ( |
| In the text | |
|
Fig. C.1. Cumulative changes in the rate of tidal friction ( |
| In the text | |
Current usage metrics show cumulative count of Article Views (full-text article views including HTML views, PDF and ePub downloads, according to the available data) and Abstracts Views on Vision4Press platform.
Data correspond to usage on the plateform after 2015. The current usage metrics is available 48-96 hours after online publication and is updated daily on week days.
Initial download of the metrics may take a while.