Fig. 10.
Download original image
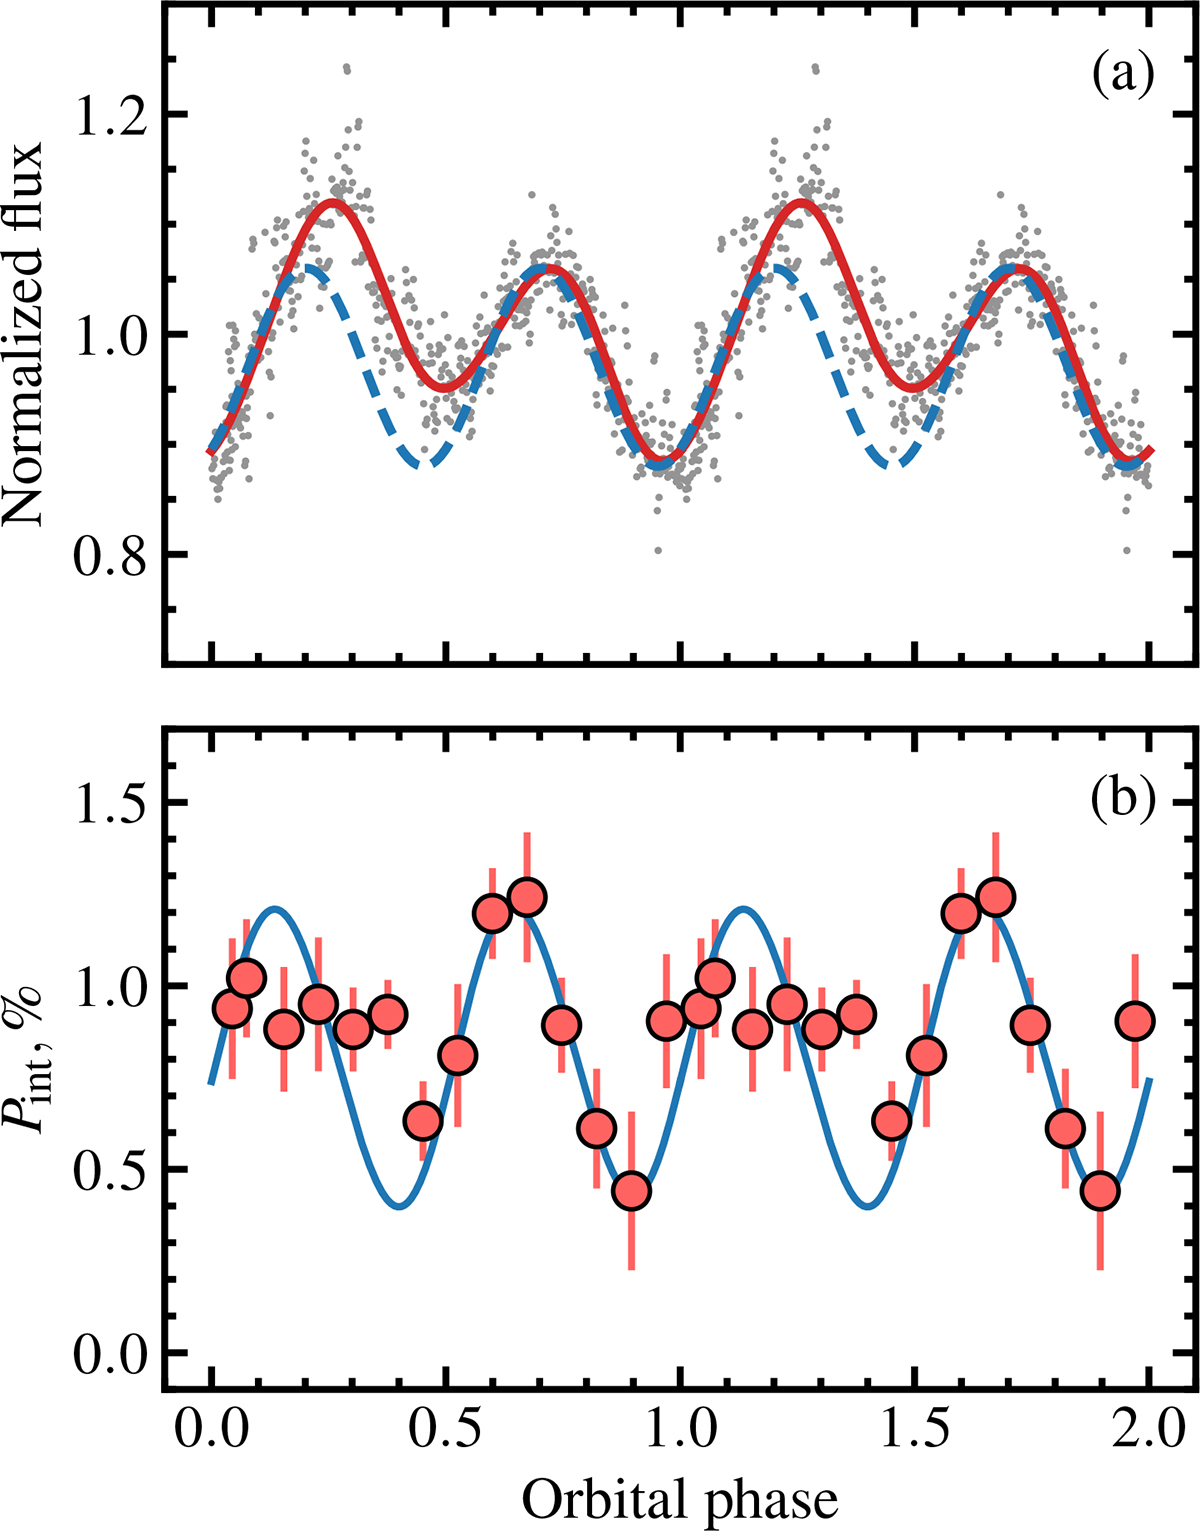
Flux and PD variations of A0620−00. Panel (a): Normalized flux, folded with the orbital phase (gray circles). The solid red line corresponds to the best fit of the data with the Fourier series, while the dashed blue line corresponds to the sinusoidal variations, assumed to be produced by the tidally distorted optical companion. Panel (b): Intrinsic PD of A0620−00 (red circles) folded with the orbital period together with the model of a scattering cloud on a circular orbit from the appendix of Kravtsov et al. 2020 (blue line).
Current usage metrics show cumulative count of Article Views (full-text article views including HTML views, PDF and ePub downloads, according to the available data) and Abstracts Views on Vision4Press platform.
Data correspond to usage on the plateform after 2015. The current usage metrics is available 48-96 hours after online publication and is updated daily on week days.
Initial download of the metrics may take a while.