| Issue |
A&A
Volume 703, November 2025
|
|
|---|---|---|
| Article Number | A14 | |
| Number of page(s) | 9 | |
| Section | Stellar structure and evolution | |
| DOI | https://doi.org/10.1051/0004-6361/202451446 | |
| Published online | 03 November 2025 | |
Optical and near-infrared polarization of the black hole X-ray binary A0620−00 in quiescence
1
Department of Physics and Astronomy, FI-20014 University of Turku, Finland
2
Nordita, KTH Royal Institute of Technology and Stockholm University, Hannes Alfvéns väg 12, SE-10691 Stockholm, Sweden
3
Instituto de Astrofísica de Canarias, E-38205 La Laguna, Tenerife, Spain
4
Departamento de Astrofísica, Universidad de La Laguna, E-38206 La Laguna, Tenerife, Spain
5
Astrophysics Research Institute, Liverpool John Moores University, 146 Brownlow Hill, Liverpool L3 5RF, United Kingdom
6
Serco for the European Space Agency (ESA), European Space Astronomy Centre, Camino Bajo del Castillo s/n, E-28692 Villanueva de la Cañada, Madrid, Spain
7
Graduate School of Sciences, Tohoku University, Aoba-ku, 980-8578 Sendai, Japan
8
Istituto Ricerche Solari Aldo e Cele Daccó (IRSOL), Faculty of Informatics, Universitá della Svizzera italiana, 6605 Locarno, Switzerland
9
Institut für Sonnenphysik (KIS), Georges-Köhler-Allee 401a, 79110 Freiburg, Germany
⋆ Corresponding author: vakrau@utu.f
Received:
10
July
2024
Accepted:
25
August
2025
Abstract
We present simultaneous high-precision optical polarimetric and near-infrared (NIR) to ultraviolet (UV) photometric observations of the low-mass black hole X-ray binary A0620−00 in a quiescent state. Subtracting interstellar polarization, estimated from a sample of field stars, we derived the intrinsic polarization of A0620−00. We show that the intrinsic polarization degree (PD) varies with the orbital period with an amplitude of ∼0.3%, at least in the R band, where the signal-to-noise ratio of our observations is the best. This implies that some fraction of the optical polarization is produced by a scattering of stellar radiation off the matter that follows the black hole in its orbital motion. In addition, we see a rotation of the orbit-average intrinsic polarization angle (PA) with the wavelength from 163° in the R to 177° in the B band. All of the above, combined with the historical NIR-to-optical polarimetric observations, demonstrates the complex behavior of the average intrinsic polarization of A0620−00: the PA continuously rotates from the infrared to the blue band by ∼53° in total, while the PD of ∼1% remains nearly constant over the entire spectral range. The spectral dependence of the PA can be described by Faraday rotation with a rotation measure of −0.2 rad μm−2, implying a magnetic field of a few gauss in the plasma surrounding the black hole accretion disk. However, our preferred interpretation of the peculiar wavelength dependence is an interplay between two polarized components with different PAs. Polarimetric measurements in the UV range can help in distinguishing between these scenarios.
Key words: accretion / accretion disks / polarization / stars: black holes / stars: individual: A0620–00 / X-rays: binaries
© The Authors 2025
 Open Access article, published by EDP Sciences, under the terms of the Creative Commons Attribution License (https://creativecommons.org/licenses/by/4.0), which permits unrestricted use, distribution, and reproduction in any medium, provided the original work is properly cited.
This article is published in open access under the Subscribe to Open model. This email address is being protected from spambots. You need JavaScript enabled to view it. to support open access publication.
1. Introduction
A0620−00 is the prototypical black hole (BH) low-mass X-ray binary (LMXB). It was discovered during its 1975 outburst (Elvis et al. 1975), when its luminosity increased by more than a million times compared to the quiescent levels, reaching the Eddington luminosity. Since then, the object has been in a quiescent state, with its spectrum dominated by the emission of a 0.4 M⊙ K-type star orbiting a ∼6 M⊙ BH (McClintock & Remillard 1986; van Grunsven et al. 2017) with an orbital period (Porb) of 7.75 h. Nevertheless, additional sources of nonstellar origin (such as jet, accretion disk, inner hot accretion flow, and hot spot) were considered in the literature to explain the excess of radio, infrared (IR), and ultraviolet (UV) emission of A0620−00 near quiescence (McClintock et al. 1995; Muno & Mauerhan 2006; Froning et al. 2011; Gallo et al. 2019; Cherepashchuk et al. 2019). Their contributions to the broadband spectrum are difficult to distinguish, especially in light of the alteration between accretion modes (passive, loop, and active modes; Cantrell et al. 2008). An additional source of information is needed to distinguish between different spectral models. Polarization of the optical radiation may provide such information.
Optical and near-infrared (NIR) radiation produced in various physical processes, including the electron scattering of stellar radiation off the accretion disk or flow and synchrotron emission in the presence of an ordered magnetic field, can be polarized. The polarization degree (PD), polarization angle (PA), and their spectral properties are different for different processes, which makes polarimetry a powerful technique for studies of the physical mechanisms responsible for the optical and NIR emission production in BH X-ray binaries. A recent systematic study has shown, however, that in many quiescent BHs, the intrinsic optical polarization (corrected for interstellar contribution) is very small – in most cases Pint ≲ 0.5% (Kravtsov et al. 2022). On the other hand, several BH LMXBs show significant polarization during (or near) quiescence: MAXI J1820+070 had a high PD (up to 5%), with the blue spectrum and PA different from the jet direction, suggesting a BH spin-orbit misalignment (Poutanen et al. 2022); A0620−00 had ∼1% optical and NIR polarization in the quiescent state (Dubus et al. 2008; Russell et al. 2016).
In X-ray quiescence, A0620−00 shows optical state changes: according to the (Cantrell et al. 2008) classification, there are two different states of optical activity – passive and active. In the passive state, variations in the optical flux are consistent with ellipsoidal variations produced by the rotation of the tidally distorted optical companion. In the active state, the source is 20% brighter and shows an aperiodic high-frequency variation usually called “flickering.”
In this paper we present the results of quasi-simultaneous high-precision optical polarimetric and multiwavelength (NIR to UV) photometric observations of A0620−00 during its passive quiescent state. The paper is organized as follows. In Sect. 2 we describe the observational data. In Sect. 3 we present the main results of our study: determination of the intrinsic optical polarization of A0620−00, its significant orbital variability, and the rotation of the average intrinsic PA with wavelength. In Sect. 4 we discuss possible physical mechanisms that can reproduce the observed behavior. Finally, in Sect. 5 we summarize our findings.
2. Data acquisition and analysis
2.1. Optical polarimetric observations
High-precision optical polarimetric observations of A0620−00 were performed using broadband BVR polarimeter DIPol-UF (Piirola et al. 2021), a visitor instrument installed at the 2.56 m Nordic Optical Telescope (NOT), Observatorio del Roque de los Muchachos, La Palma, Spain. Field stars used for the interstellar (IS) polarization estimation were observed with DIPol-2 (Piirola et al. 2014), mounted on the remotely controlled 60 cm Tohoku telescope (T60) at Haleakala Observatory, Hawaii. Both polarimeters utilize a “double-image” design that effectively eliminates the polarization of the sky, even if it varies throughout the observations. The instrumental polarization of both instruments is small (< 10−4) and was well calibrated by observing of 10–15 unpolarized standard stars. The zero points of the PAs were determined by observing highly polarized standards HD 236928 and HD 25443. A more detailed description of the methods and calibrations can be found in Piirola et al. (2020) and Kravtsov et al. (2022), and references therein.
A0620−00 was observed on two nights between 2022 December 24 and 26, and 140 and 52 individual measurements of the Stokes parameters were made on the two nights, respectively. The first observation was continuous, 8 h long, and hence covered the whole orbital period of the binary, while the second observation covered only 40% of the period. Hereafter we refer to the average polarization measured during the first observation as the orbit-averaged polarization. Each individual linear polarization measurement was obtained from four consecutive images with 50-s exposures taken at different half-wave plate positions, resulting in one polarization measurement per ∼3.3 min. To increase the signal-to-noise ratio, we split the data into bins such that each bin contains ten individual measurements of the Stokes parameters. The errors of the normalized Stokes parameters q and u were computed as the standard errors of the weighted mean values within the bin. The Stokes parameters (q, u) then were translated into the PD (P) and PA (θ),
 (1)
(1)
The uncertainty on the PD is equal to the uncertainty of the individual Stokes parameters, and uncertainty on the PA in radians was estimated as σθ = σP/(2P) (Serkowski 1962; Kosenkov et al. 2017). The phase-resolved PD was corrected for the bias caused by the low signal-to-noise ratio using the relation P0 = (P2 − 2σP2)1/2 (Simmons & Stewart 1985).
2.2. Multiwavelength photometry
Quasi-simultaneous multiwavelength photometric observational campaign was organized on several telescopes (see Table 1). Near-infrared JHK photometry was made using EMIR wide-field imager (Garzón et al. 2022), installed on the 10.4 m Gran Telescopio Canarias (GTC), La Palma, Spain. Observations in the broadband SDSS-ugriz, Bessel V, and Bessel B filters were performed using IO:O instrument of the 2-m Liverpool Telescope (LT; Steele et al. 2004), La Palma, Spain. For all the instruments, basic data reductions such as bias and dark subtraction and flat fielding are done via the internal common pipelines. As the photometric standards, we used two stars with known Sloan Digital Sky Survey (SDSS) magnitudes. To obtain fluxes of the object from its magnitudes we used standard zero-points for SDSS and Johnson-Cousins systems (Fukugita et al. 1996; Bessell 1979).
Polarimetric and photometric observations of A0620−00 in December 2022.
2.3. Swift/UVOT
The Neil Gehrels Swift Observatory (Gehrels et al. 2004) observed A0620−00 four times from 2022 December 23 to 26 (see Table 1) with total exposure of about 7 ks. The image analysis has been done following the procedure provided by the UK Swift Science Data Centre1. Photometry in all available filters (V, B, U, UVW1, UVW2, and UVM2) was performed using the tool UVOTSOURCE from the HEASOFT package version 6.32 and the latest calibration files. The source and background photons were extracted from the apertures with radii of 5″ and 10″, respectively. The background was chosen with the center about 18″ away from the source for all filters.
For the spectral fitting, all available data were converted to the spectral files. For the Swift/UVOT data the UVOT2PHA tool was applied using the corresponding response files in the CALDB. All other data were converted to the spectral files using tool FTFLX2XSP from the FTOOLS package. The following spectral fitting was performed using XSPEC version 12.13.1 (Arnaud 1996).
3. Results
3.1. Average intrinsic polarization
The observed optical polarization of a distant star is a combination of the intrinsic polarization of the object and IS polarization. The main source of the IS polarization (qis, uis) is the optical dichroism of nonspherical IS dust particles aligned by Galactic magnetic field. The observed polarization of A0620−00 is dominated by the IS component, as evidenced by the rough alignment (within 10°; see Fig. 1) of the observed PA of the source with those of the field stars. To extract the intrinsic polarization (qint, uint) of A0620−00 from the observed polarization (qobs, uobs), we first estimated the IS polarization. IS polarization usually depends on the distance to the source and may be different at different wavelengths. To study it, we observed four close field stars with similar Gaia DR3 (Gaia Collaboration 2021) parallaxes in the BVR bands (see Table 2). The observations of the brightest field star (Ref 1) show very little wavelength dependence of IS polarization in the direction to A0620−00 in the optical band – it is consistent with being constant with wavelength at the level of better than σis, λ = 0.05% (blue circle in Figs. 2 and 3). Thus, one zero point (qis, uis) for IS polarization can be used for all three optical bands. Due to the possible dependence on distance, the exact position of this zero point on the qu-plane is uncertain. Different approaches can be used to set this zero point: one can use either the Stokes parameters of the closest in distance field star or the weighted average Stokes parameters of the group of field stars located at similar distances. We used the later approach to find (qis, uis) based on the observations of the field stars Ref 1 – Ref 3, for which the accuracy of our observations was the best. The scatter in their Stokes parameters determines the systematic error on the IS polarization zero point  (shown as red circle in Figs. 2 and 3). To find the intrinsic polarization of A0620−00, we subtracted the IS Stokes parameters (qis, uis) from the observed Stokes parameters (qobs, uobs) of the source. The statistical errors on the intrinsic Stokes parameters of A0620−00 were calculated as σint2 = σobs2 + σis, λ2; the σis, λ2 term includes possible dependence of the IS polarization on wavelength. Then, Eq. (1) is used to calculate the PD and PA together with their statistical errors. The systematic error σis, sys on the IS zero point translates to the systematic errors of the intrinsic PD and PA
  and
and  .
.
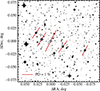 |
Fig. 1. Polarization map of A0620−00 (at the origin) and field stars in the R band. The lines correspond to the observed polarization, with the length of the bars showing the PD, and the direction indicating the PA (measured from north to east). |
Polarization of field stars and A0620−00.
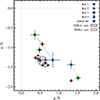 |
Fig. 2. Observed orbit-average Stokes parameters of A0620−00 (squares) and field stars in the B, V, and R bands (blue, green, and red markers, respectively). The light blue circle shows the uncertainty of the IS polarization with wavelength σis, λ; the light red circle shows the systematic error on the IS polarization zero point, σis, sys. |
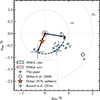 |
Fig. 3. Intrinsic Stokes parameters of the polarization of A0620−00 in quiescence measured in different filters from the Ks to B, as indicated by letters near each data point. The light blue circle at the origin illustrates the possible uncertainty of the IS polarization with wavelength, σis, λ; the light red circle shows the systematic error on the IS polarization zero point, σis, sys. The red and blue arrows indicate the intrinsic polarization vector directions in the Ks and B bands, respectively. The dashed curved arrow shows the track left by the intrinsic polarization vector during its rotation from the IR to the blue part of the spectrum. An orange star shows the polarization of A0620−00 in V measured during the 1975 outburst by Dolan (1976). |
Subtracting the IS component from the observed polarization, we find the average intrinsic polarization of A0620−00 to be P= 0.8–1.0% with θ changing from 163° in the R filter to 177° in B (see Table 3). The fit with a constant to the intrinsic PA gives unacceptable fit with χ2/d.o.f. = 10/2. Combining NIR polarimetric observations (Russell et al. 2016) corrected for IS polarization with our optical measurements, we see the continuous rotation of the intrinsic polarization vector with the wavelength from NIR to B (see Fig. 3). The fit with a constant to all intrinsic PAs from NIR to B gives unacceptable fit with χ2/d.o.f. = 32/6. The amplitude of the polarization vector rotation on the sky is Δθ = θ(B)−θ(Ks)≈53° (see Fig. 4). In contrast to the PA, PD barely changes with wavelength remaining at ∼1% level from Ks to B band (constant fit gives χ2/d.o.f. = 5/6).
One-orbit-average observed and intrinsic PD and PA of A0620−00 together with the IS polarization estimate.
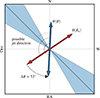 |
Fig. 4. Rotation of the polarization on the sky. Red and blue arrows correspond to the direction of the polarization in the B and Ks filters, respectively. The blue region shows the direction of the radio ejections as measured in Kuulkers et al. (1999). |
We note that although the determination of the intrinsic PA strongly depends on the accuracy of the IS polarization estimate, there is an additional reason to believe that the intrinsic polarization estimate is close to its true value. Although the observed PD of A0620−00 in Dubus et al. (2008)V-band observations was significantly higher than in this paper, subtracting our estimate of the IS polarization from their observed Stokes parameters, we get the PA of intrinsic polarization matching our value within a few degrees – this can be seen in Fig. 3, if one connects the origin to the corresponding observational points and compare the directions of the resulting vectors. This alignment of the intrinsic polarization vectors is unlikely to be coincidental and may appear naturally if the intrinsic PD of the source changes while the PA is stable.
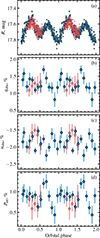 |
Fig. 5. Orbital profiles of the flux and of the normalized Stokes parameters of A0620−00. Solid blue and empty red circles correspond to the data from two different orbits. Panel (a): Photometric R magnitudes of A0620−00 folded with the orbital period. Panels (b) and (c): Observed normalized Stokes parameters. Panel (d): Intrinsic PD of A0620−00 in the R filter folded with the orbital period. Each circle with a 1σ error bar shows the 35-minute average polarization. |
3.2. Orbital variability of the polarization
We folded the photometric and polarimetric observations of A0620−00 in the R band (for which the S/N is the best) with the orbital period using the recent ephemeris of Cherepashchuk et al. (2019). We find significant variability of intrinsic polarization of the source in the R filter (Fig. 5b,c). We plotted the orbital profile of the observed polarization together with the optical light curve of A0620−00, obtained simultaneously (Fig. 5a). We see the pronounced peak in PD at the orbital phase of 0.75 and two minima at phases around 0.5 and 1.0. Similar peak in PD around phase 0.7 has been observed by Dolan & Tapia (1989). Such polarization behavior with minima in conjunctions and maxima in quadratures is expected and has been observed in other binary systems (discussed in detail in Sect. 4.3), and although our observations covered only 1.5 orbits, and the S/N for individual bins is at the threshold of significance, we can still cautiously state that the nature of observed polarization variability is more likely to be orbital rather than stochastic. The absence of flickering in the photometric observations together with the visual magnitude V = 18.3 ± 0.1 of A0620−00 suggests that the source was in the passive quiescent state during our campaign (Cantrell et al. 2008).
3.3. Broadband spectrum
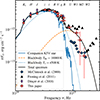 |
Fig. 6. SED of A0620−00, corrected for reddening assuming E(B − V) = 0.35. Red squares with error bars correspond to the data from this paper. Blue crosses, black triangles, and purple diamonds show data from McClintock & Remillard (2000), Froning et al. (2011), and Dinçer et al. (2018), respectively. Solid blue, dotted blue, and dashed orange lines show the spectra of the K5V star (Pickles 1998), the blackbody of T* = 4500 K, and an additional blackbody of Tbb = 10 000 K, respectively. |
The observed NIR-to-UV spectral energy distribution (SED) of A0620−00 in passive quiescent state, corrected for reddening assuming E(B − V) = 0.35 (Wu et al. 1983) is shown in Fig. 6. The key feature of the SED is the excess of UV photons, previously observed in the quiescent state (Froning et al. 2011; McClintock et al. 1995) – an extra source of UV radiation in addition to the optical companion is needed to reproduce the observed shape of the spectrum. The spectrum alone, however, does not allow an unambiguous separation of the second component: even the simplest model with one additional blackbody is degenerate due to the uncertainty in the stellar spectrum normalization. Various different methods were used to estimate the contribution of nonstellar emission to the quiescent spectrum of A0620−00 (Marsh et al. 1994; Gelino et al. 2001; Harrison et al. 2007; Froning et al. 2011; Dinçer et al. 2018). Despite the fact that there is no complete consensus, it can be cautiously noted that most authors agree that the companion star dominates the entire NIR-to-optical range in the passive quiescent state, with the contribution of additional component increasing toward the blue part of the spectrum. The additional component becomes comparable with the stellar flux only near the B band, where its contribution reaches 20–50%. Nonstellar emission spectrum can be described with the blackbody of temperature Tbb= 9000–11 000 K depending on the state of activity. The nature of the additional component is still under discussion, but most likely it corresponds to the brightest part of the accretion disk (either the hot inner disk regions or the bright spot formed at the impact point of the accretion stream). The bright spot is clearly present in the Doppler tomograms (Marsh et al. 1994; Shahbaz et al. 1994, 2004; Neilsen et al. 2008) and it is needed to explain the asymmetric light curves (Froning & Robinson 2001; Cantrell et al. 2010; van Grunsven et al. 2017; Cherepashchuk et al. 2019). The contribution of the nonstellar radiation is variable on short (Haswell et al. 1993) and long (Cantrell et al. 2008) timescales. Our new observations are consistent with both interpretations (see Fig. 6 and Sect. 4).
4. Discussion
4.1. The source of the polarization
The first optical polarimetric observations of A0620−00 were performed during its 1975 outburst (Dolan 1976, see the orange star in Fig. 3). The observed PD, PA, and their spectral properties were found to be consistent with the IS origin. Our IS polarization estimate is very close to the outburst polarization level of A0620−00, which confirms the above statement. Sub-percent intrinsic optical polarization of A0620−00 is in line with that of the other BH X-ray binaries – most known sources observed during the outburst show low intrinsic polarization levels (XTE J1118+480, Schultz et al. 2004; MAXI J0637−430, Kravtsov et al. 2019; MAXI J1820+070, Veledina et al. 2019; Kosenkov et al. 2020; Swift J1727.8−1613, Kravtsov et al. 2023a; V404 Cyg, Tanaka et al. 2016; Kosenkov et al. 2017; GX 339−4, Mastroserio et al. 2025; LMC X-3, Boyd et al. 2001). However, the intrinsic PD of some BH LMXBs increases significantly as they approach quiescence (e.g., MAXI J1820+070, Poutanen et al. 2022, and A0620−00, Dubus et al. 2008). Intrinsic optical polarization is also detected in some NS X-ray binaries (Aql X-1, Charles et al. 1980; Cyg X-2, Koch Miramond & Naylor 1995; Sco X-1, Schultz et al. 2004; 4U 0614+091, Baglio et al. 2014; XTE J1709–267, Higgins et al. 2019).
The orbit-averaged intrinsic polarization of A0620−00 in the quiescent state has nearly the same PD ∼ 1% at all wavelengths from the Ks to B band, yet PA shows a significant rotation over those wavelengths (Fig. 3). This makes A0620−00 the only source known to date for which such a strong PA dependence on the wavelength is observed. Such polarization behavior cannot be explained in terms of simple mechanisms of polarization production. Indeed, if the polarization is produced mostly by scattering, its PA should not depend on the wavelength.
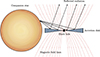 |
Fig. 7. Schematic illustration of the scattering geometry (not to scale). |
We first studied the case in which the observed dependence of PA on wavelength is caused by Faraday rotation. We considered the scenario illustrated in Fig. 7. The unpolarized radiation of the companion star gets scattered by the accretion disk and the polarized scattered radiation has initial PA independent of the wavelength. After the scattering, the linearly polarized radiation propagates toward the observer through the magnetized plasma surrounding the accretion disk. The PA of the light propagating along the magnetic field lines experiences the Faraday rotation, resulting in the observed PA dependence on wavelength.
The PA of linearly polarized radiation propagating through the magnetized plasma rotates with the wavelength λ as
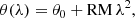 (2)
(2)
where the rotation measure (RM) is defined through the integral along the line of sight:
 (3)
(3)
where ne is the electron number density, B|| (in G) is the line of sight magnetic field strength, e is the electric charge, me is the electron mass and c is the speed of light. If B|| is constant, the RM can be expressed through the Thomson optical depth τT = ∫neσTdl. In this case, RM ≈ 0.4τTB|| rad μm−2.
We used Eq. (2) with parameters θ0 and RM to find the best-fit solution for the Faraday rotation of PA in our optical points and NIR points reported in Russell et al. (2016). We find the best-fit parameters θ0 = 175 ° ±4° and RM = −0.20 ± 0.01 rad μm−2 (see Fig. 8). The latter value gives the relation between the line-of-sight optical depth and magnetic field (in gauss) τTB|| ≈ 0.5. For the realistic values of matter density in quiescence τT ≲ 0.1, we find B ≳ 5 G. This value is roughly consistent with the magnetic fields expected in the quiescent-state optically thin accretion flows (Wallace & Pe’er 2021), which may be similar to those of optically thin plasma surrounding the disk (Fig. 7).
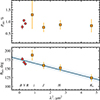 |
Fig. 8. Dependence of the intrinsic PD and PA of A0620−00 on λ2. The circles and squares correspond to optical observations from this paper and NIR polarimetric observations from Russell et al. (2016), respectively. The blue line shows the best-fit Faraday rotation model given by Eq. (2). |
We note, however, that the NIR data were taken almost ten years prior to our optical observations, and hence potential magnetic field variations may lead to the inconsistency of trends between the optical and NIR PA points. We indeed observe that our recent measurements (leftmost three points in Fig. 8) lie on a straight line with the slope differing from the general trend. If we apply Eq. (2) only to our data, we obtain θ0 = 186 ° ±6° and RM = −1.3 ± 0.3 rad μm−2 (see Fig. 8). This translates to τTB|| ≈ 3.2, requiring almost seven times higher magnetic field strength for the Faraday rotation to occur in the optically thin plasma (τT ≲ 1).
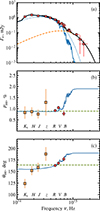 |
Fig. 9. Polarimetric properties of A0620−00. Panel (a): Energy dependence of flux (Fν), as in Fig. 6 but only the data from this paper are shown. Panels (b) and (c): Energy dependence of the intrinsic PD and PA of A0620−00. Circles and squares correspond to optical observations from this paper and NIR polarimetric observations from Russell et al. (2016), respectively. The blue line corresponds to the model with two polarized components described in Sect. 4.1. Dashed green lines correspond to the constant polarization model. |
Next, we considered the scenario in which the observed polarization arises from two components: one coming from the scattering of the stellar light and the other from the polarized contribution of the additional UV component. The scattering component is assumed to have constant PD and PA, which implies a constant fraction of the scattered radiation, and spectrum as that of the optical companion (solid blue line in Fig. 9a). The additional UV component (dashed orange line), which was used to describe the UV part of the observed SED, is set to have constant PD and PA, whose values were free to vary. The blue lines in Fig. 9b and c show the dependence of PD and PA for this two-component scenario. To reproduce the rotation of the PA from the NIR to the B band, the components must have different PAs: PAsc ≈ 150° and PAUV ≈ 190°. Because the components have comparable contribution to the optical flux, the PD of the UV component (PDUV ≈ 1.8%) should be significantly higher than that of the scattering component (PDsc ≈ 0.8%) to dominate the PA in B. The polarization of the UV component can arise from the first (single) Compton up-scattering of the disk or synchrotron photons by electrons in the hot accretion flow, similar to the case of MAXI J1820+070 (Poutanen et al. 2022). The difference of PA in the scattered and UV components can then indicate misalignment by ∼50° (or ∼40°) between the axes of these components. This scenario predicts rise of PD and further rotation of PA toward the UV band (see Fig. 9).
While this model fairly well describes the rotation of the optical PA, it cannot reproduce the dataset in full detail. First of all, the intrinsic PAs in Ks and z differ from the model predictions. This difference may arise due to the fact that the observations in NIR were preformed a decade prior to the optical campaign while the source may have been in a different state (loop or active, Cantrell et al. 2008). There is evidence that in active quiescent state, the additional component contributes to the NIR part of the spectrum (Froning et al. 2007; Dinçer et al. 2018; Cherepashchuk et al. 2019), which could be a jet, an accretion stream-disk impact point, or a dusty circumbinary disk (Muno & Mauerhan 2006; Gallo et al. 2007; Cherepashchuk et al. 2019). This additional NIR component, not present in our passive state observations, could however be responsible for an additional polarization in the Ks band in the epoch of the Russell et al. (2016) observations; that would explain the observed difference in the PA. Some deviations in NIR may also arise from the Faraday rotation. Additionally, although the model describes the flat PD spectrum from NIR to R reasonably well and replicates the PD rise due to the absorption line in V well, the PD in B is about 0.3% lower than the level predicted by the model. The reason for the apparent drop of the PD in B is unknown, but we argue that the actual broadband spectrum of an object obtained simultaneously with polarization measurements should be used instead of the model spectrum of the companion star to analyze such subtle effects. Polarimetric observation in the UV band, in which we expect significant increase in the PD, can unambiguously infer the nature of PA rotation in A0620−00 and, subsequently, shed light on the nature of the UV excess in the binary.
4.2. On the synchrotron origin of the polarization
Synchrotron emission has been suggested to contribute to the polarization of A0620−00 in NIR in addition to scattering (Russell et al. 2016). By assuming the scattering component to have polarization with PA ∼ 173° and PD ∼ 1% and by subtracting it from the observed Ks polarization, authors got the PD of synchrotron emission to be ∼1.3%. Then, by assuming the jet contribution in Ks to be 8–37%, authors found the jet to be polarized at the level of PDjet = 3–18%. However, we argue that such a separation of polarized components cannot be done unambiguously with the existing data for several reasons.
First, the PA changes significantly within the optical range, meaning that polarization cannot be produced by scattering alone. Therefore, the PA of the scattered component cannot be determined explicitly with the optical data only. In previous section, we estimated the PA of scattered component to be closer to ∼150°, which, if subtracted from observed Ks polarization, would result in much smaller PD of synchrotron emission ∼0.8% with the PA of ∼180°. We note also that although the observed PA in Ks seems to be perpendicular to the possible direction of the radio jet (see Fig. 4), after subtracting the scattering contribution, the PA of remaining synchrotron component differs from the jet axis by about 45°, which cannot be easily explained with the jet model. Second, there is no direct evidence of the presence of NIR excess in the photometric data in passive quiescence. The apparent increase in the flux in NIR relative to blackbody is well described by the stellar spectrum alone – the “bump” at Ks and H is well pronounced in the K5V companion spectrum in Fig. 6. Therefore, it is rather difficult to determine the contribution of jet emission to the observed spectrum, especially given the strong variability of the object both within and between states. Adding the jet as a third component in addition to the scattering and UV components to the modeling is hardly justified given the quality and the number of polarimetric observations. Taking all of the above into account, although we do not rule out the possibility that jet contributes to the NIR polarization, we argue that its accurate determination is a challenging task that requires more precise simultaneous multiwavelength polarimetric observations than we have to date.
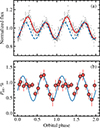 |
Fig. 10. Flux and PD variations of A0620−00. Panel (a): Normalized flux, folded with the orbital phase (gray circles). The solid red line corresponds to the best fit of the data with the Fourier series, while the dashed blue line corresponds to the sinusoidal variations, assumed to be produced by the tidally distorted optical companion. Panel (b): Intrinsic PD of A0620−00 (red circles) folded with the orbital period together with the model of a scattering cloud on a circular orbit from the appendix of Kravtsov et al. 2020 (blue line). |
4.3. The source of the polarization variations
In addition to the changes in the polarization between different spectral states, we also see intra-day variability of the polarization. Although the 2% orbital modulation of the polarization observed by Dolan & Tapia (1989) has not been confirmed (Dubus et al. 2008), we see the variations at a level of 0.3% on timescales of hours (see Fig. 5). To confidently claim that the polarization of A0620−00 is variable with the orbital phase, one would need to cover at least two consecutive orbital periods with high-precision polarimetric observations (which is a rather difficult task given the brightness of the object in quiescence and its short orbital period). That said, we can cautiously state that the observed polarization variability is related to the orbital phase rather than having a stochastic nature. Indeed, the polarization of A0620−00, folded with the orbital phase, shows the pattern typical for binary stars – double-sinusoidal variations with the PD reaching minima in the conjunctions (phases 0 and 0.5) and maxima in the quadratures (phases 0.25 and 0.75). This is due to Thomson scattering of the stellar radiation on the matter, which follows the compact object in its orbital motion (Brown et al. 1978; Kravtsov et al. 2020), and is similar to what is observed in other BH (Kemp et al. 1979; Gliozzi et al. 1998; Kravtsov et al. 2023b) and neutron star (Egonsson & Hakala 1991; Combi et al. 2004; Baglio et al. 2016) X-ray binaries. In Fig. 10 we see a fairly good agreement of the PD variations with the expected behavior (the blue line shows the model of a scattering cloud on a circular orbit; see the appendix of Kravtsov et al. 2020). In addition, our first and second observations, performed during two different orbits are consistent with each other (see Fig. 5). We note also that Stokes parameters of A0620−00, folded with the orbital period, show scatter, similar to one observed in Dubus et al. (2008) – while Stokes q shows more pronounced orbital variability, Stokes u seems to behave more erratically. The amplitude of this scatter, however, is comparable to the measurement errors, which complicates its interpretation, but one explanation could be the presence of inhomogeneities (clumps) in the scattering matter.
The optical light curve shown in Fig. 10 has an asymmetric profile – the peak and the dip at the first half of the orbit are brighter than the other peak and dip. The so-called ellipsoidal variations of the flux, produced by the tidally distorted optical star (shown by the dashed blue line at Fig. 10), cannot produce such asymmetry; therefore, an additional source of flux variations is needed. There are two alternatives: either there is an additional bright component visible only at the first part of the orbit and generating additional flux (e.g., non-circular accretion disk or bright spot in the accretion stream; see, e.g., Haswell et al. 1993), or some object blocks the light of the optical companion, reducing the total flux at phases from 0.5 to 1.0 (e.g., dark spots at the surface of the star; e.g., Cherepashchuk et al. 2019). We see similar asymmetry in the orbital polarization profile of A0620−00 – while around orbital phases from 0.5 to 1.0 the PD shows good agreement with the Thomson scattering model, at the first part of the orbit the PD is consistent with being constant. The additional bright unpolarized component, visible only at phases from 0.0 to 0.5, could reduce the polarization at these phases and explain both the asymmetric PD and flux variations; therefore, we argue that the bright spot or phase-dependent disk models are more likely than the dark star spot model. Another alternative is that the asymmetric PD profile is produced by scattering of stellar radiation off slightly tilted accretion disk. In this scenario, the illuminated part of the accretion disk is visible to the observer only for half of the orbit (see Kravtsov et al. 2023b). However, scattering alone is not enough to reproduce the ∼10% increase in flux observed at the first half of the orbit, and the quality of our polarimetric data is not sufficient to discriminate between the complex models.
5. Conclusions
We have presented new high-precision phase-resolved optical polarimetric and quasi-simultaneous NIR-to-UV photometric observations of BH X-ray binary A0620−00 in a passive quiescent state. We determined and subtracted the IS polarization, which allowed us to derive the intrinsic polarization of A0620−00. Using that combined with the NIR polarimetric observations from Russell et al. (2016), we found that the orbit-average intrinsic PA rotates with the wavelength, changing from 124° in the Ks filter to 177° in B, while the PD remains at the ∼1% level throughout this spectral range. Folding our polarimetric observations with the orbital period, we found the significant orbital variability of polarization properties in the R band. The shape of the variations, with two minima and two maxima per period, suggests that the polarization is most probably produced by Thomson scattering of the companion star emission off the matter, which follows the BH in its orbital motion (e.g., scattering off the accretion disk or stream). The lack of variations during the first part of the orbit suggests either that we see a depolarization effect caused by the bright spot visible only at these phases or (less probably) that the scattering material producing the polarization is obscured or tilted relative to the orbital axis. However, more high-precision polarimetric observations from at least several consecutive orbital periods are needed to draw unambiguous conclusions about the geometry of the scattering medium.
The flat spectrum of the polarization and the presence of the orbital variations suggest that NIR-to-optical polarization has a scattering origin. However, in that case, the PA is not expected to change with the wavelength as observed. We first considered the possibility that stellar radiation scattered off the accretion disk experiences Faraday rotation while traveling toward the observer through the magnetized plasma surrounding the accretion disk. The estimated values of the magnetic field and optical depth can be considered consistent with realistic estimates if we take into account our optical points in combination with the NIR points taken almost ten years ago. On the other hand, the steep trend of our optical points favors a higher Faraday rotation rate, resulting in higher values for the line-of-sight magnetic field.
We considered the scenario of two polarized components that have different PDs and PAs. One component is coming from the stellar scattered light and the other is associated with the additional UV component seen in the spectrum. The second component may potentially arise from Compton up-scattering of the disk or synchrotron photons in the hot inner flow, similar to what is seen in the quiescent-state low-mass BH X-ray binary MAXI J1820+070. The PAs of these components differ by ∼40°, which translates to either a 50° or 40° misalignment between their axes of symmetry. Future simultaneous polarimetric observations covering the NIR-to-UV range would be extremely helpful in unambiguously determining which of the two models best represents A0620−00.
Acknowledgments
Based on observations made with the Nordic Optical Telescope, owned in collaboration by the University of Turku and Aarhus University, and operated jointly by Aarhus University, the University of Turku, and the University of Oslo, representing Denmark, Finland, and Norway, the University of Iceland and Stockholm University at the Observatorio del Roque de los Muchachos, La Palma, Spain, of the Instituto de Astrofisica de Canarias. The DIPol-2 and DIPol-UF polarimeters were built in cooperation between the University of Turku, Finland, and the Leibniz-Institut für Sonnenphysik, Germany. The Liverpool Telescope is operated on the island of La Palma by Liverpool John Moores University in the Spanish Observatorio del Roque de los Muchachos of the Instituto de Astrofisica de Canarias with financial support from the UK Science and Technology Facilities Council. MAPT acknowledge support from the Agencia Estatal de Investigación (MCIN/AEI) and the European Regional Development Fund under grant PID2021-124879NB-I00. This research has been supported by the Finnish Cultural Foundation (VK) and by the Academy of Finland grants 355672 (AV). Nordita is supported in part by NordForsk.
References
- Arnaud, K. A. 1996, ASP Conf. Ser., 101, 17 [Google Scholar]
- Baglio, M. C., Mainetti, D., D’Avanzo, P., et al. 2014, A&A, 572, A99 [NASA ADS] [CrossRef] [EDP Sciences] [Google Scholar]
- Baglio, M. C., D’Avanzo, P., Campana, S., et al. 2016, A&A, 587, A102 [NASA ADS] [CrossRef] [EDP Sciences] [Google Scholar]
- Bessell, M. S. 1979, PASP, 91, 589 [Google Scholar]
- Boyd, P. T., Smale, A. P., & Dolan, J. F. 2001, ApJ, 555, 822 [Google Scholar]
- Brown, J. C., McLean, I. S., & Emslie, A. G. 1978, A&A, 68, 415 [NASA ADS] [Google Scholar]
- Cantrell, A. G., Bailyn, C. D., McClintock, J. E., & Orosz, J. A. 2008, ApJ, 673, L159 [Google Scholar]
- Cantrell, A. G., Bailyn, C. D., Orosz, J. A., et al. 2010, ApJ, 710, 1127 [NASA ADS] [CrossRef] [Google Scholar]
- Charles, P. A., Thorstensen, J. R., Bowyer, S., et al. 1980, ApJ, 237, 154 [Google Scholar]
- Cherepashchuk, A. M., Katysheva, N. A., Khruzina, T. S., et al. 2019, MNRAS, 483, 1067 [Google Scholar]
- Combi, J. A., Cellone, S. A., Martí, J., et al. 2004, A&A, 427, 959 [NASA ADS] [CrossRef] [EDP Sciences] [Google Scholar]
- Dinçer, T., Bailyn, C. D., Miller-Jones, J. C. A., Buxton, M., & MacDonald, R. K. D. 2018, ApJ, 852, 4 [NASA ADS] [Google Scholar]
- Dolan, J. F. 1976, ApJ, 210, 721 [Google Scholar]
- Dolan, J. F., & Tapia, S. 1989, PASP, 101, 1135 [NASA ADS] [CrossRef] [Google Scholar]
- Dubus, G., Kern, B. D., Chaty, S., & Foellmi, C. 2008, Proc. Sci., 62, 115 [Google Scholar]
- Egonsson, J., & Hakala, P. 1991, A&A, 244, L41 [Google Scholar]
- Elvis, M., Page, C. G., Pounds, K. A., Ricketts, M. J., & Turner, M. J. L. 1975, Nature, 257, 656 [Google Scholar]
- Froning, C. S., & Robinson, E. L. 2001, AJ, 121, 2212 [Google Scholar]
- Froning, C. S., Robinson, E. L., & Bitner, M. A. 2007, ApJ, 663, 1215 [Google Scholar]
- Froning, C. S., Cantrell, A. G., Maccarone, T. J., et al. 2011, ApJ, 743, 26 [Google Scholar]
- Fukugita, M., Ichikawa, T., Gunn, J. E., et al. 1996, AJ, 111, 1748 [Google Scholar]
- Gaia Collaboration (Brown, A. G. A., et al.) 2021, A&A, 649, A1 [NASA ADS] [CrossRef] [EDP Sciences] [Google Scholar]
- Gallo, E., Migliari, S., Markoff, S., et al. 2007, ApJ, 670, 600 [NASA ADS] [CrossRef] [Google Scholar]
- Gallo, E., Teague, R., Plotkin, R. M., et al. 2019, MNRAS, 488, 191 [Google Scholar]
- Garzón, F., Balcells, M., Gallego, J., et al. 2022, A&A, 667, A107 [CrossRef] [EDP Sciences] [Google Scholar]
- Gehrels, N., Chincarini, G., Giommi, P., et al. 2004, ApJ, 611, 1005 [Google Scholar]
- Gelino, D. M., Harrison, T. E., & Orosz, J. A. 2001, AJ, 122, 2668 [Google Scholar]
- Gliozzi, M., Bodo, G., Ghisellini, G., Scaltriti, F., & Trussoni, E. 1998, A&A, 337, L39 [Google Scholar]
- Harrison, T. E., Howell, S. B., Szkody, P., & Cordova, F. A. 2007, AJ, 133, 162 [NASA ADS] [CrossRef] [Google Scholar]
- Haswell, C. A., Robinson, E. L., Horne, K., Stiening, R. F., & Abbott, T. M. C. 1993, ApJ, 411, 802 [Google Scholar]
- Higgins, A. B., Wiersema, K., Covino, S., et al. 2019, MNRAS, 482, 5023 [NASA ADS] [CrossRef] [Google Scholar]
- Kemp, J. C., Barbour, M. S., Parker, T. E., & Herman, L. C. 1979, ApJ, 228, L23 [NASA ADS] [CrossRef] [Google Scholar]
- Koch Miramond, L., & Naylor, T. 1995, A&A, 296, 390 [Google Scholar]
- Kosenkov, I. A., Berdyugin, A. V., Piirola, V., et al. 2017, MNRAS, 468, 4362 [NASA ADS] [CrossRef] [Google Scholar]
- Kosenkov, I. A., Veledina, A., Berdyugin, A. V., et al. 2020, MNRAS, 496, L96 [NASA ADS] [CrossRef] [Google Scholar]
- Kravtsov, V., Berdyugin, A., Veledina, A., et al. 2019, ATel., 13291, 1 [Google Scholar]
- Kravtsov, V., Berdyugin, A. V., Piirola, V., et al. 2020, A&A, 643, A170 [NASA ADS] [CrossRef] [EDP Sciences] [Google Scholar]
- Kravtsov, V., Berdyugin, A. V., Kosenkov, I. A., et al. 2022, MNRAS, 514, 2479 [NASA ADS] [CrossRef] [Google Scholar]
- Kravtsov, V., Nitindala, A. P., Veledina, A., et al. 2023a, ATel., 16245, 1 [Google Scholar]
- Kravtsov, V., Veledina, A., Berdyugin, A. V., et al. 2023b, A&A, 678, A58 [NASA ADS] [CrossRef] [EDP Sciences] [Google Scholar]
- Kuulkers, E., Fender, R. P., Spencer, R. E., Davis, R. J., & Morison, I. 1999, MNRAS, 306, 919 [Google Scholar]
- Marsh, T. R., Robinson, E. L., & Wood, J. H. 1994, MNRAS, 266, 137 [NASA ADS] [CrossRef] [Google Scholar]
- Mastroserio, G., De Marco, B., Baglio, M. C., et al. 2025, ApJ, 978, L19 [Google Scholar]
- McClintock, J. E., & Remillard, R. A. 1986, ApJ, 308, 110 [Google Scholar]
- McClintock, J. E., & Remillard, R. A. 2000, ApJ, 531, 956 [Google Scholar]
- McClintock, J. E., Horne, K., & Remillard, R. A. 1995, ApJ, 442, 358 [Google Scholar]
- Muno, M. P., & Mauerhan, J. 2006, ApJ, 648, L135 [NASA ADS] [CrossRef] [Google Scholar]
- Neilsen, J., Steeghs, D., & Vrtilek, S. D. 2008, MNRAS, 384, 849 [Google Scholar]
- Pickles, A. J. 1998, PASP, 110, 863 [NASA ADS] [CrossRef] [Google Scholar]
- Piirola, V., Berdyugin, A., & Berdyugina, S. 2014, Proc. SPIE, 9147, 91478I [NASA ADS] [Google Scholar]
- Piirola, V., Berdyugin, A., Frisch, P. C., et al. 2020, A&A, 635, A46 [NASA ADS] [CrossRef] [EDP Sciences] [Google Scholar]
- Piirola, V., Kosenkov, I. A., Berdyugin, A. V., Berdyugina, S. V., & Poutanen, J. 2021, AJ, 161, 20 [Google Scholar]
- Poutanen, J., Veledina, A., Berdyugin, A. V., et al. 2022, Science, 375, 874 [NASA ADS] [CrossRef] [Google Scholar]
- Russell, D. M., Shahbaz, T., Lewis, F., & Gallo, E. 2016, MNRAS, 463, 2680 [NASA ADS] [CrossRef] [Google Scholar]
- Schultz, J., Hakala, P., & Huovelin, J. 2004, Baltic Astron., 13, 581 [Google Scholar]
- Serkowski, K. 1962, Adv. Astron. Astrophys., 1, 289 [CrossRef] [Google Scholar]
- Shahbaz, T., Ringwald, F. A., Bunn, J. C., et al. 1994, MNRAS, 271, L10 [Google Scholar]
- Shahbaz, T., Hynes, R. I., Charles, P. A., et al. 2004, MNRAS, 354, 31 [Google Scholar]
- Simmons, J. F. L., & Stewart, B. G. 1985, A&A, 142, 100 [NASA ADS] [Google Scholar]
- Steele, I. A., Smith, R. J., Rees, P. C., et al. 2004, Proc. SPIE, 5489, 679 [NASA ADS] [CrossRef] [Google Scholar]
- Tanaka, Y. T., Itoh, R., Uemura, M., et al. 2016, ApJ, 823, 35 [Google Scholar]
- van Grunsven, T. F. J., Jonker, P. G., Verbunt, F. W. M., & Robinson, E. L. 2017, MNRAS, 472, 1907 [Google Scholar]
- Veledina, A., Berdyugin, A. V., Kosenkov, I. A., et al. 2019, A&A, 623, A75 [NASA ADS] [CrossRef] [EDP Sciences] [Google Scholar]
- Wallace, J., & Pe’er, A. 2021, ApJ, 916, 63 [Google Scholar]
- Wu, C. C., Panek, R. J., Holm, A. V., Schmitz, M., & Swank, J. H. 1983, PASP, 95, 391 [CrossRef] [Google Scholar]
All Tables
One-orbit-average observed and intrinsic PD and PA of A0620−00 together with the IS polarization estimate.
All Figures
|
Fig. 1. Polarization map of A0620−00 (at the origin) and field stars in the R band. The lines correspond to the observed polarization, with the length of the bars showing the PD, and the direction indicating the PA (measured from north to east). |
| In the text | |
|
Fig. 2. Observed orbit-average Stokes parameters of A0620−00 (squares) and field stars in the B, V, and R bands (blue, green, and red markers, respectively). The light blue circle shows the uncertainty of the IS polarization with wavelength σis, λ; the light red circle shows the systematic error on the IS polarization zero point, σis, sys. |
| In the text | |
|
Fig. 3. Intrinsic Stokes parameters of the polarization of A0620−00 in quiescence measured in different filters from the Ks to B, as indicated by letters near each data point. The light blue circle at the origin illustrates the possible uncertainty of the IS polarization with wavelength, σis, λ; the light red circle shows the systematic error on the IS polarization zero point, σis, sys. The red and blue arrows indicate the intrinsic polarization vector directions in the Ks and B bands, respectively. The dashed curved arrow shows the track left by the intrinsic polarization vector during its rotation from the IR to the blue part of the spectrum. An orange star shows the polarization of A0620−00 in V measured during the 1975 outburst by Dolan (1976). |
| In the text | |
|
Fig. 4. Rotation of the polarization on the sky. Red and blue arrows correspond to the direction of the polarization in the B and Ks filters, respectively. The blue region shows the direction of the radio ejections as measured in Kuulkers et al. (1999). |
| In the text | |
|
Fig. 5. Orbital profiles of the flux and of the normalized Stokes parameters of A0620−00. Solid blue and empty red circles correspond to the data from two different orbits. Panel (a): Photometric R magnitudes of A0620−00 folded with the orbital period. Panels (b) and (c): Observed normalized Stokes parameters. Panel (d): Intrinsic PD of A0620−00 in the R filter folded with the orbital period. Each circle with a 1σ error bar shows the 35-minute average polarization. |
| In the text | |
|
Fig. 6. SED of A0620−00, corrected for reddening assuming E(B − V) = 0.35. Red squares with error bars correspond to the data from this paper. Blue crosses, black triangles, and purple diamonds show data from McClintock & Remillard (2000), Froning et al. (2011), and Dinçer et al. (2018), respectively. Solid blue, dotted blue, and dashed orange lines show the spectra of the K5V star (Pickles 1998), the blackbody of T* = 4500 K, and an additional blackbody of Tbb = 10 000 K, respectively. |
| In the text | |
|
Fig. 7. Schematic illustration of the scattering geometry (not to scale). |
| In the text | |
|
Fig. 8. Dependence of the intrinsic PD and PA of A0620−00 on λ2. The circles and squares correspond to optical observations from this paper and NIR polarimetric observations from Russell et al. (2016), respectively. The blue line shows the best-fit Faraday rotation model given by Eq. (2). |
| In the text | |
|
Fig. 9. Polarimetric properties of A0620−00. Panel (a): Energy dependence of flux (Fν), as in Fig. 6 but only the data from this paper are shown. Panels (b) and (c): Energy dependence of the intrinsic PD and PA of A0620−00. Circles and squares correspond to optical observations from this paper and NIR polarimetric observations from Russell et al. (2016), respectively. The blue line corresponds to the model with two polarized components described in Sect. 4.1. Dashed green lines correspond to the constant polarization model. |
| In the text | |
|
Fig. 10. Flux and PD variations of A0620−00. Panel (a): Normalized flux, folded with the orbital phase (gray circles). The solid red line corresponds to the best fit of the data with the Fourier series, while the dashed blue line corresponds to the sinusoidal variations, assumed to be produced by the tidally distorted optical companion. Panel (b): Intrinsic PD of A0620−00 (red circles) folded with the orbital period together with the model of a scattering cloud on a circular orbit from the appendix of Kravtsov et al. 2020 (blue line). |
| In the text | |
Current usage metrics show cumulative count of Article Views (full-text article views including HTML views, PDF and ePub downloads, according to the available data) and Abstracts Views on Vision4Press platform.
Data correspond to usage on the plateform after 2015. The current usage metrics is available 48-96 hours after online publication and is updated daily on week days.
Initial download of the metrics may take a while.