Open Access
Fig. 10
Download original image
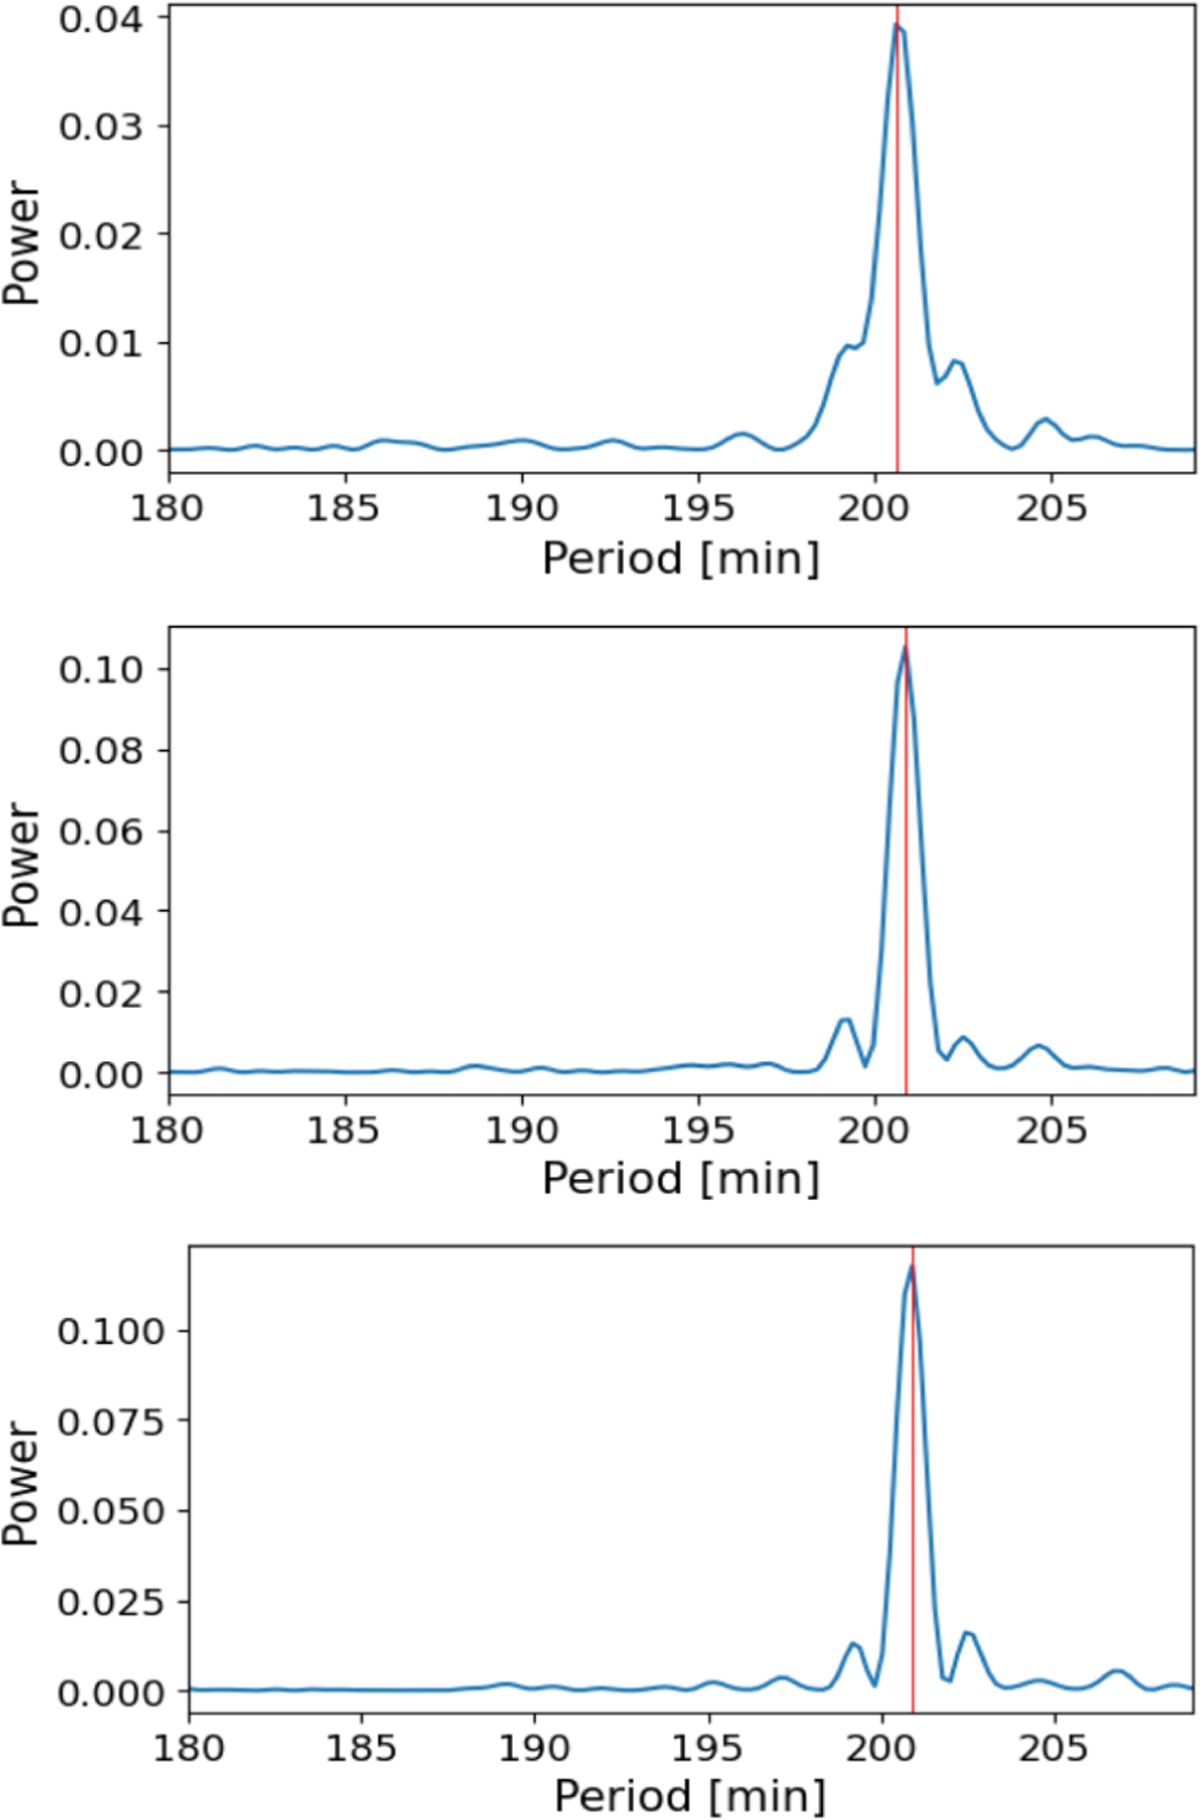
Zoomed-in views of the frequency peak at ~ 200.8 min in the Lomb-Scargle periodograms of the TESS light curves of TIC 94840820 (alias J0733+2619). Top panel: Sector 44. Centre panel: Sector 45. Bottom panel: Sector 46. The red lines mark the positions of the frequency peaks.
Current usage metrics show cumulative count of Article Views (full-text article views including HTML views, PDF and ePub downloads, according to the available data) and Abstracts Views on Vision4Press platform.
Data correspond to usage on the plateform after 2015. The current usage metrics is available 48-96 hours after online publication and is updated daily on week days.
Initial download of the metrics may take a while.