Fig. 13
Download original image
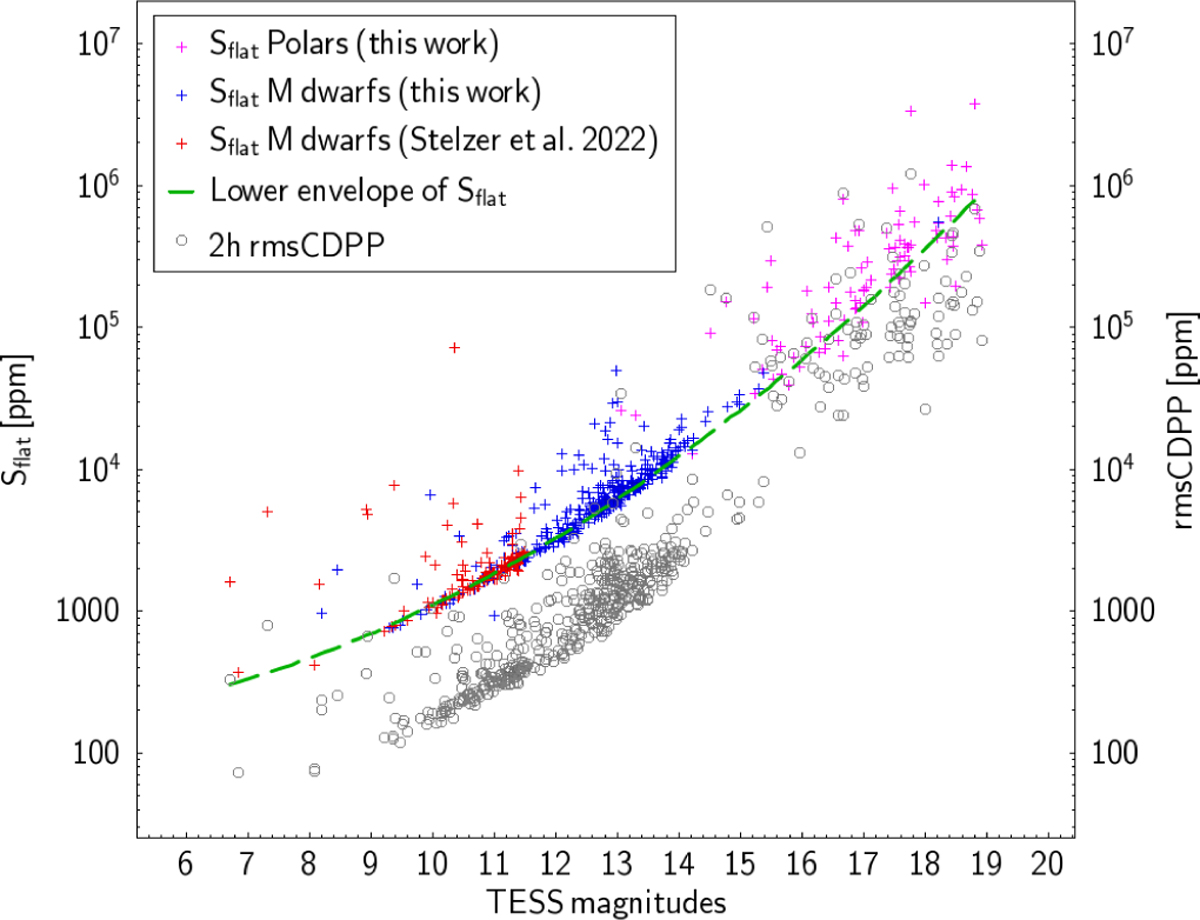
Relation between Sflat and TESS magnitude for polars (pink) compared to the same relation for the M dwarf sample from Stelzer et al. (2022) (red) and a subsample of M dwarfs from Joseph et al. (2024) (blue). The TESS light curves of the latter were analysed by us (see Sect. 5). The lower envelope of the Sflat distribution (green dashed line) was obtained by fitting a second-order polynomial to the lower 25% quantile of the data. The two-hour rmsCDPP values for all objects in the three samples are presented for comparison (see Sect. 5 for details).
Current usage metrics show cumulative count of Article Views (full-text article views including HTML views, PDF and ePub downloads, according to the available data) and Abstracts Views on Vision4Press platform.
Data correspond to usage on the plateform after 2015. The current usage metrics is available 48-96 hours after online publication and is updated daily on week days.
Initial download of the metrics may take a while.