Open Access
Fig. 16
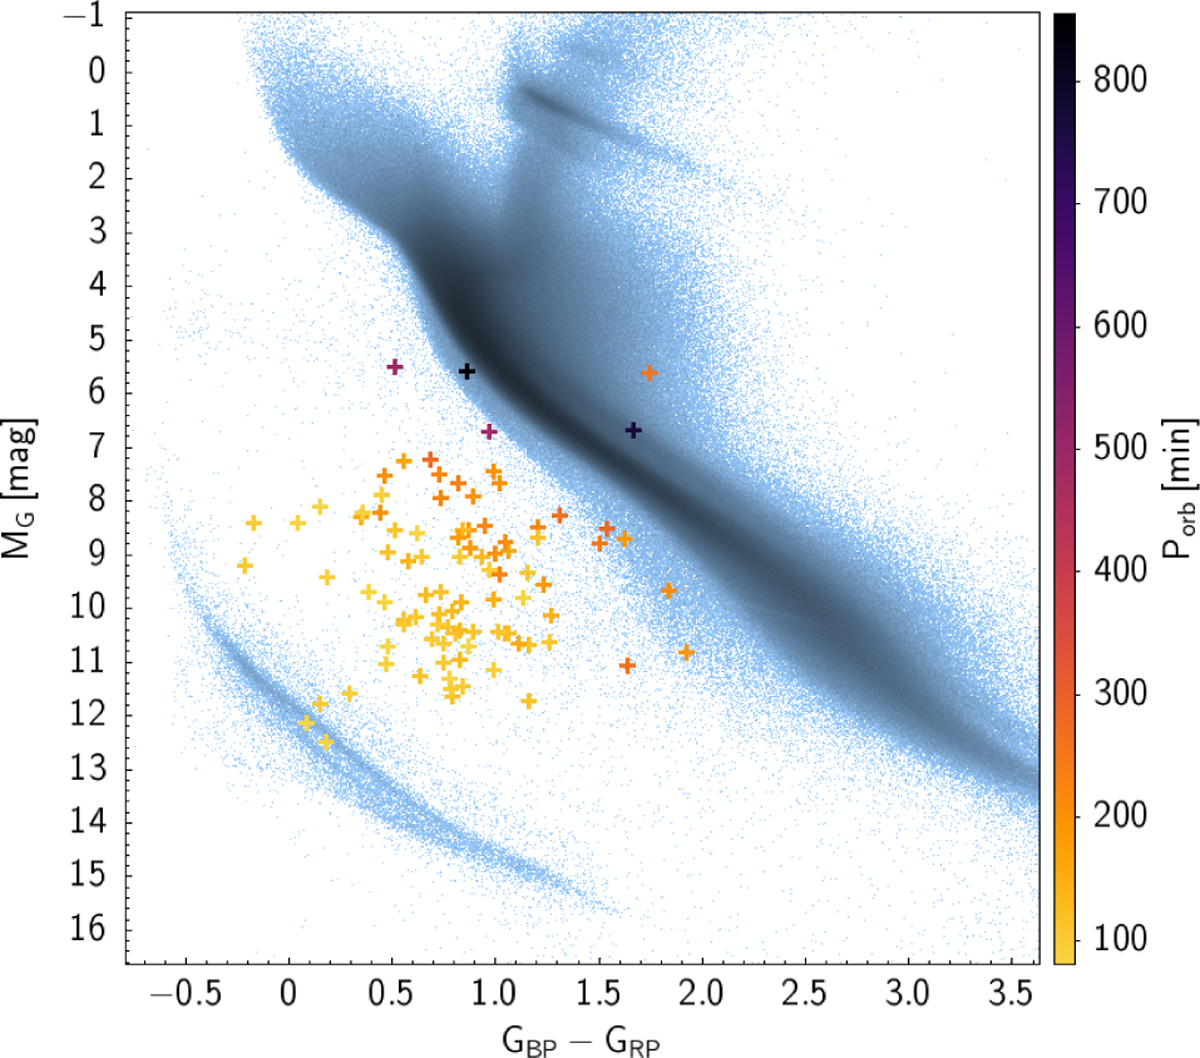
Download original image
Gaia colour-magnitude diagram showing the sample of polars with TESS two-minute cadence light curves on a background of Gaia DR3 sources with distances from Bailer-Jones et al. (2021) and a parallax error of <1% of the parallax value. The colour-coding corresponds to the measured orbital periods.
Current usage metrics show cumulative count of Article Views (full-text article views including HTML views, PDF and ePub downloads, according to the available data) and Abstracts Views on Vision4Press platform.
Data correspond to usage on the plateform after 2015. The current usage metrics is available 48-96 hours after online publication and is updated daily on week days.
Initial download of the metrics may take a while.