Fig. D.1
Download original image
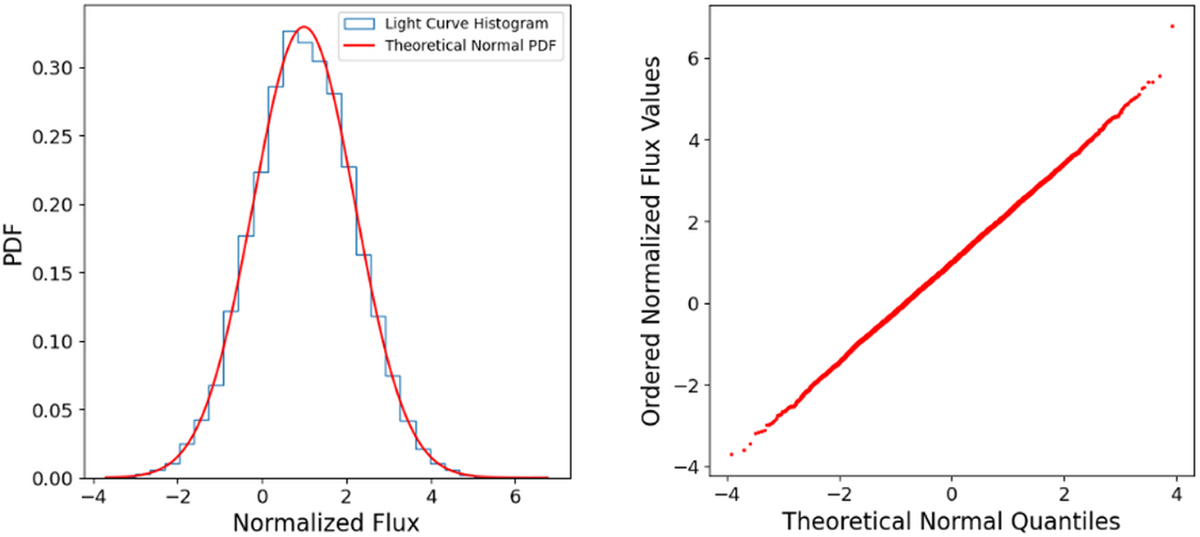
Normality plots for the light curve of TIC 840418301 in sector48. Left: Light curve histogram with the theoretical normal probability density function overplotted. The histogram’s values correspond with the probability density function at the bin. The histogram is normalised such thattheintegralovertheentirerangeis1.Right: Ordered sample data against the theoretical quantiles of the normal distribution.
Current usage metrics show cumulative count of Article Views (full-text article views including HTML views, PDF and ePub downloads, according to the available data) and Abstracts Views on Vision4Press platform.
Data correspond to usage on the plateform after 2015. The current usage metrics is available 48-96 hours after online publication and is updated daily on week days.
Initial download of the metrics may take a while.