Fig. 2
Download original image
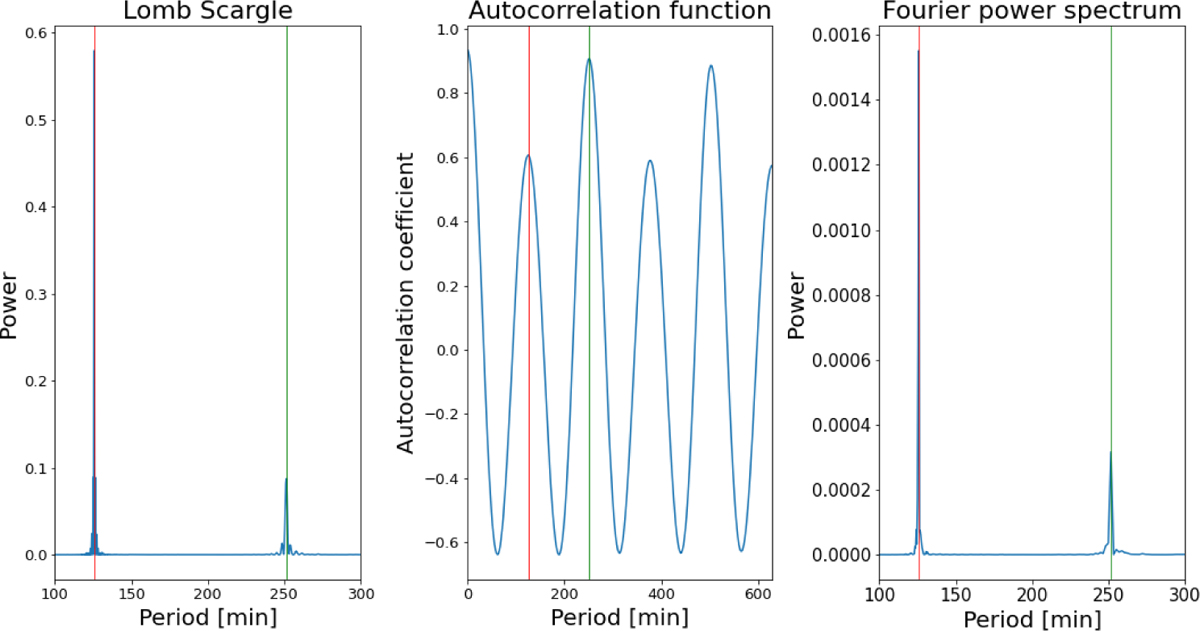
Illustration of the results from different period detection methods for a case where the dominant period is 1 /2 Porb (from left to right): Lomb-Scargle periodogram, ACF, and Fourier power spectrum. The example refers to TIC 124404442 (alias V1043 Cen) (sector 37). The red vertical lines indicate the signals at 1/2 Porb, while the green vertical lines indicate the true orbital period (Sparks & Sion 2021). In this light curve, all three methods failed to identify the orbital period. We note that although the autocorrelation coefficient at the true orbital period is higher than that at 1/2 Porb in the ACF plot, the subsequent FFT applied to the autocorrelation coefficients yields a stronger signal in 1/2 Porb.
Current usage metrics show cumulative count of Article Views (full-text article views including HTML views, PDF and ePub downloads, according to the available data) and Abstracts Views on Vision4Press platform.
Data correspond to usage on the plateform after 2015. The current usage metrics is available 48-96 hours after online publication and is updated daily on week days.
Initial download of the metrics may take a while.