Open Access
Fig. 7
Download original image
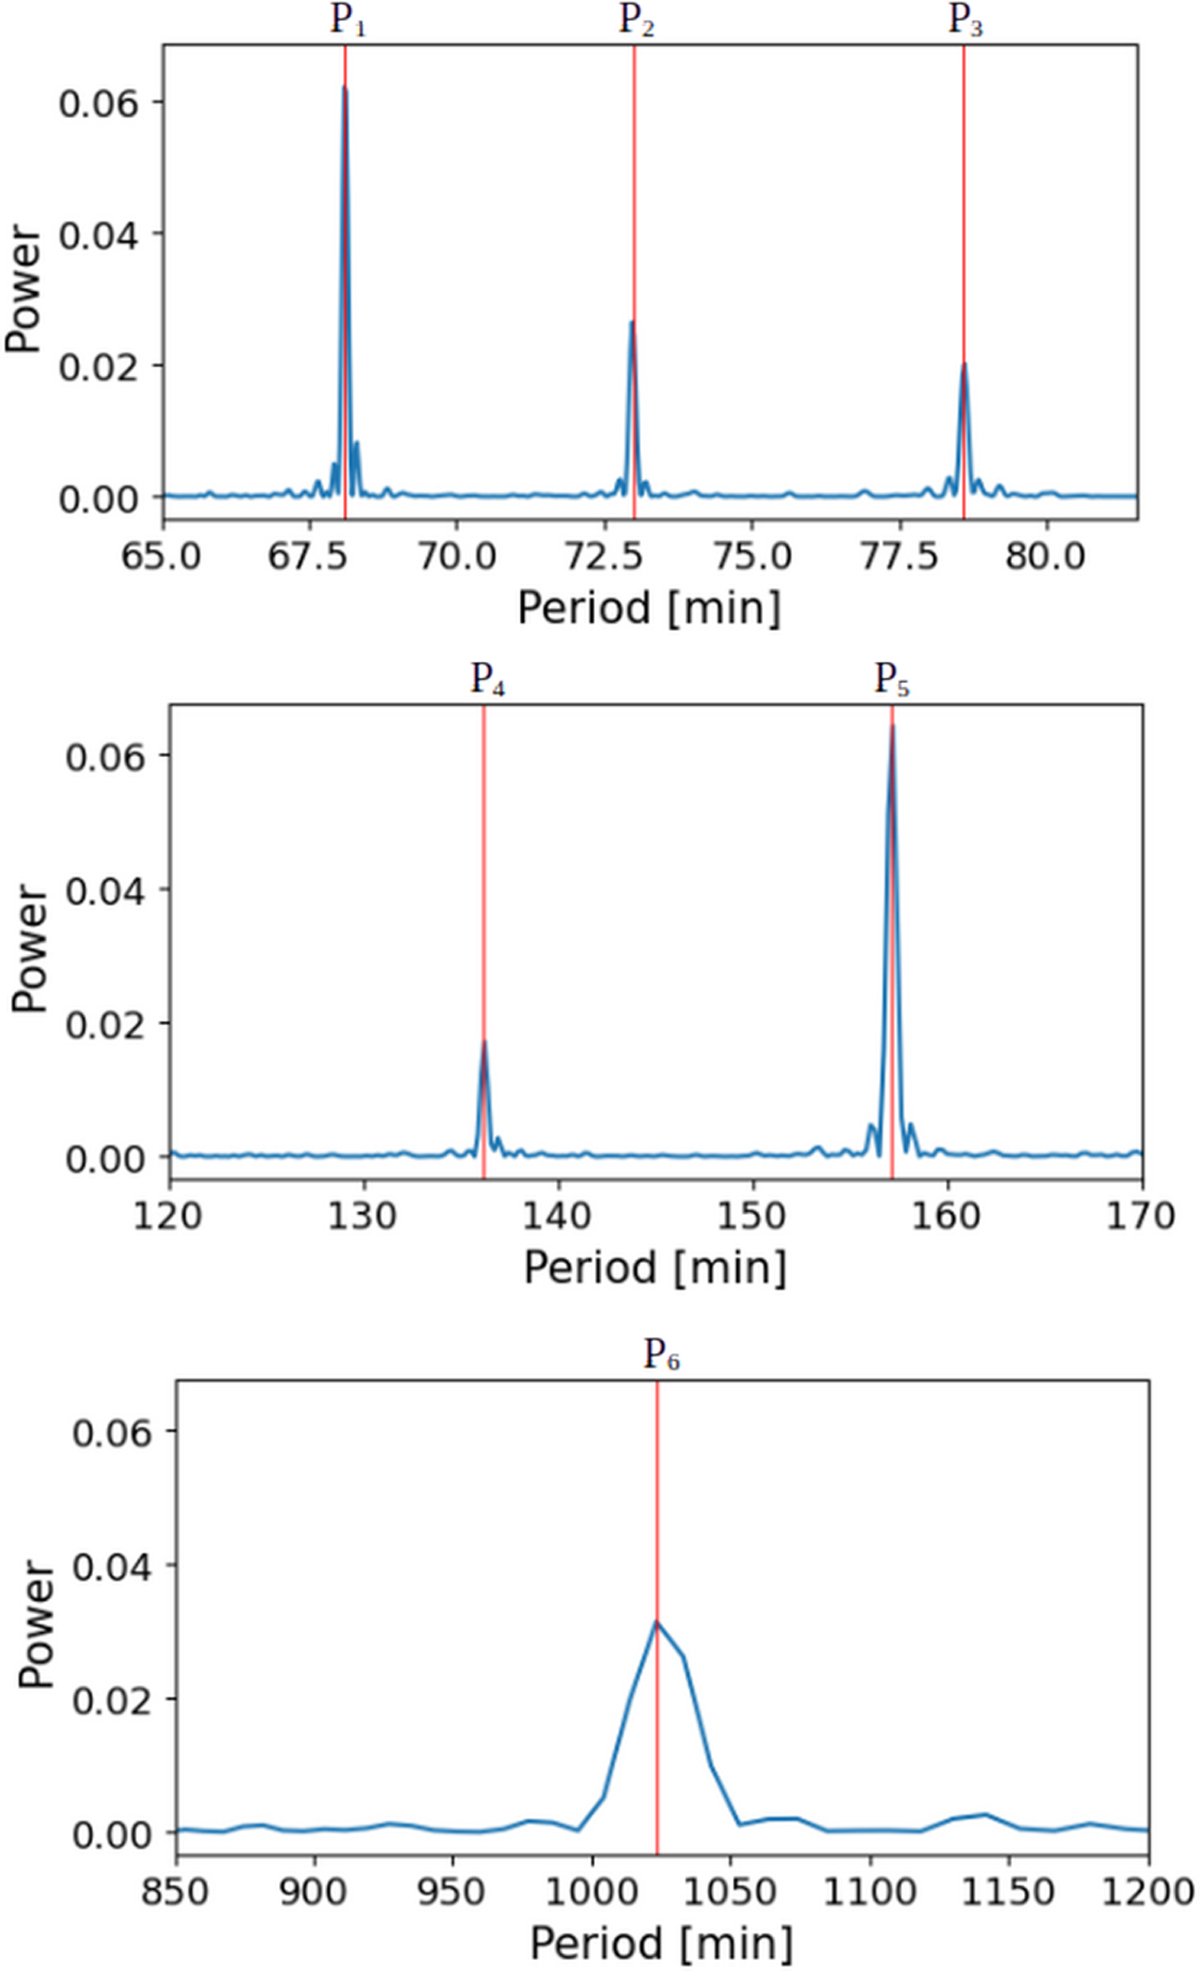
Zoomed-in view of the Lomb-Scargle periodogram of the TESS light curve of TIC 369210348 (alias Paloma) (sector 19). The red lines mark the positions of the different periods that were measured (see Table B.4).
Current usage metrics show cumulative count of Article Views (full-text article views including HTML views, PDF and ePub downloads, according to the available data) and Abstracts Views on Vision4Press platform.
Data correspond to usage on the plateform after 2015. The current usage metrics is available 48-96 hours after online publication and is updated daily on week days.
Initial download of the metrics may take a while.