Fig. 9
Download original image
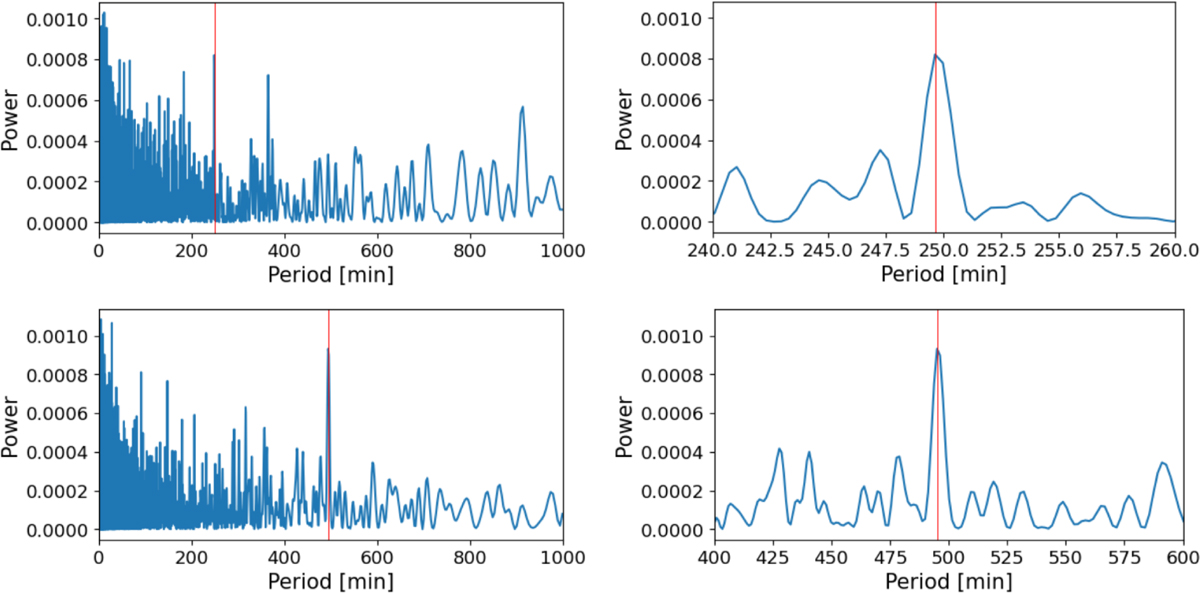
Left panels: Lomb-Scargle periodograms of the TESS light curves of TIC 908535248 (alias GQ Mus) from Sector 37 (top) and Sector 38 (bottom). Right panels: zoomed-in view of the region around the highest frequency peaks, located at 249.64 ± 0.57 min (top for Sector 37) and at 495.1 ± 2.3 min (bottom for Sector 38). The red lines mark the positions of the frequency peaks.
Current usage metrics show cumulative count of Article Views (full-text article views including HTML views, PDF and ePub downloads, according to the available data) and Abstracts Views on Vision4Press platform.
Data correspond to usage on the plateform after 2015. The current usage metrics is available 48-96 hours after online publication and is updated daily on week days.
Initial download of the metrics may take a while.