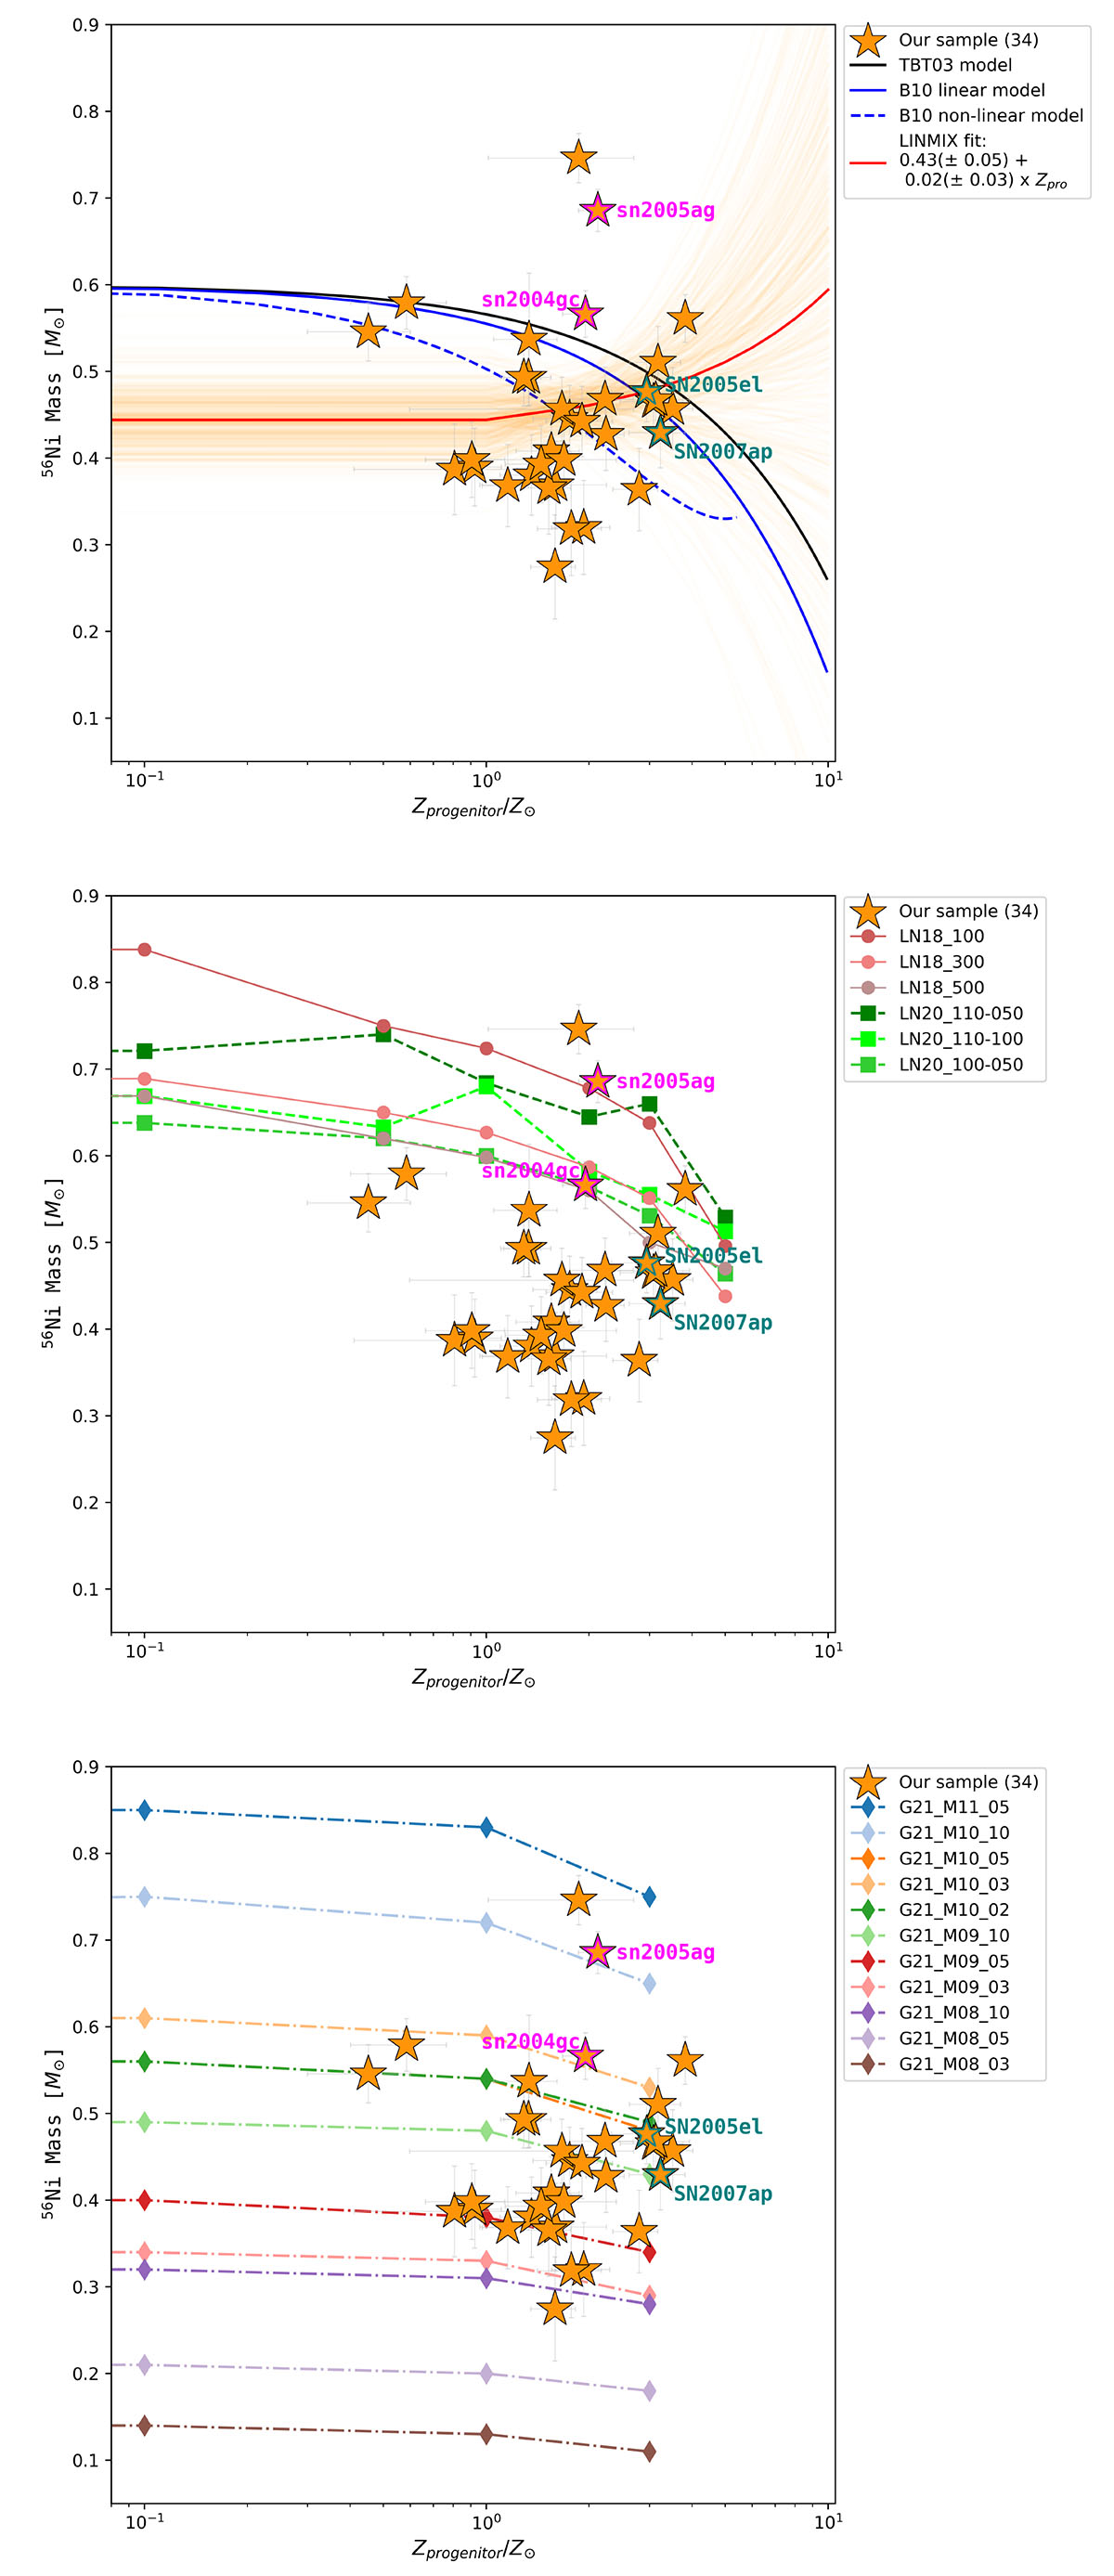
Fig. 2.
Download original image
Same as Fig. 1, but the plot is split into the SN Ia models. The top panel shows TBT03 and B10. The solid red line shows the average of 10 000 linear regression results (light red lines) from the LINMIX package, which returns a slope of 0.02 ± 0.03 (0.7σ). The middle panel shows the LN18 and LN20 models, and the bottom panel shows the G21 model. In each panel, we mark four SNe Ia that fit the LN18 and LN20 models well (magenta) and that fit the G21 model (teal).
Current usage metrics show cumulative count of Article Views (full-text article views including HTML views, PDF and ePub downloads, according to the available data) and Abstracts Views on Vision4Press platform.
Data correspond to usage on the plateform after 2015. The current usage metrics is available 48-96 hours after online publication and is updated daily on week days.
Initial download of the metrics may take a while.