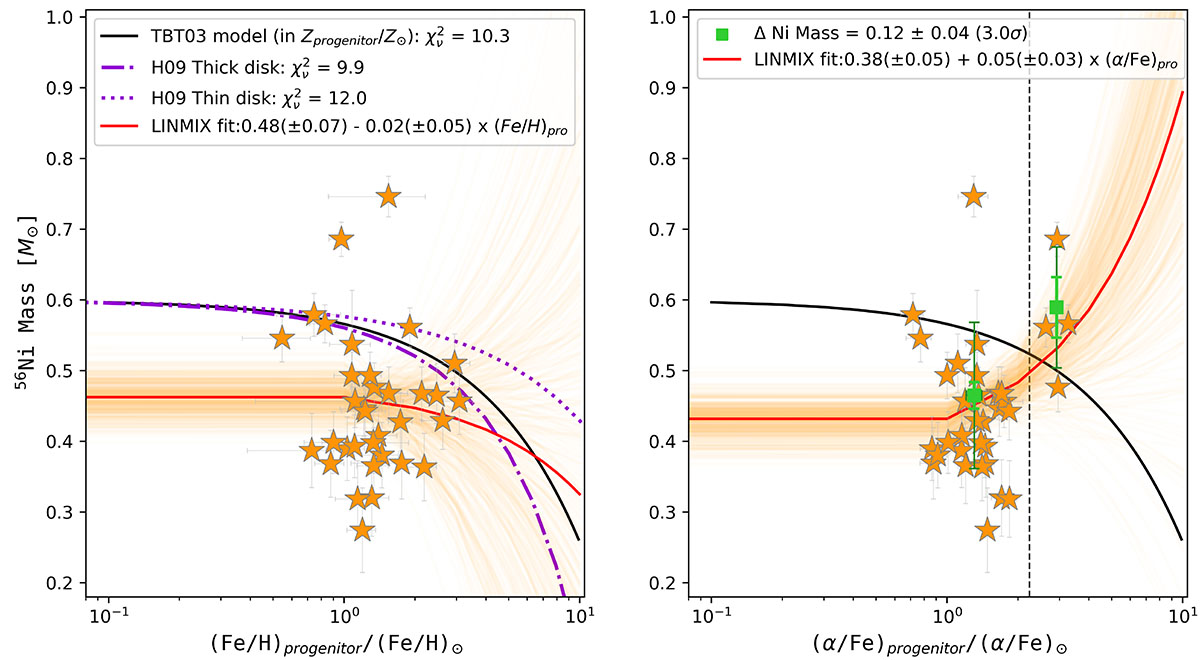
Fig. 3.
Download original image
56Ni mass synthesized during the SN Ia explosion as a function of the progenitor iron abundance ((Fe/H)progenitor) and α-element enrichment ((α/Fe)progenitor). The TBT03 model is plotted as a solid black line, even in the expression of Zprogenitor/Z⊙. The solid red lines show the average of 10 000 linear regression results (light red lines) from the LINMIX package. In the left panel, dot-dashed and dotted purple lines present the TBT03 model, altered for thick- and thin-disk models by H09, respectively. The vertical dashed line in the right panel indicates (α/Fe)progenitor = 0.35, showing a clear gap as discussed by K24. The green squares represent the weighted-means of 56Ni mass in each (α/Fe)progenitor bin.
Current usage metrics show cumulative count of Article Views (full-text article views including HTML views, PDF and ePub downloads, according to the available data) and Abstracts Views on Vision4Press platform.
Data correspond to usage on the plateform after 2015. The current usage metrics is available 48-96 hours after online publication and is updated daily on week days.
Initial download of the metrics may take a while.