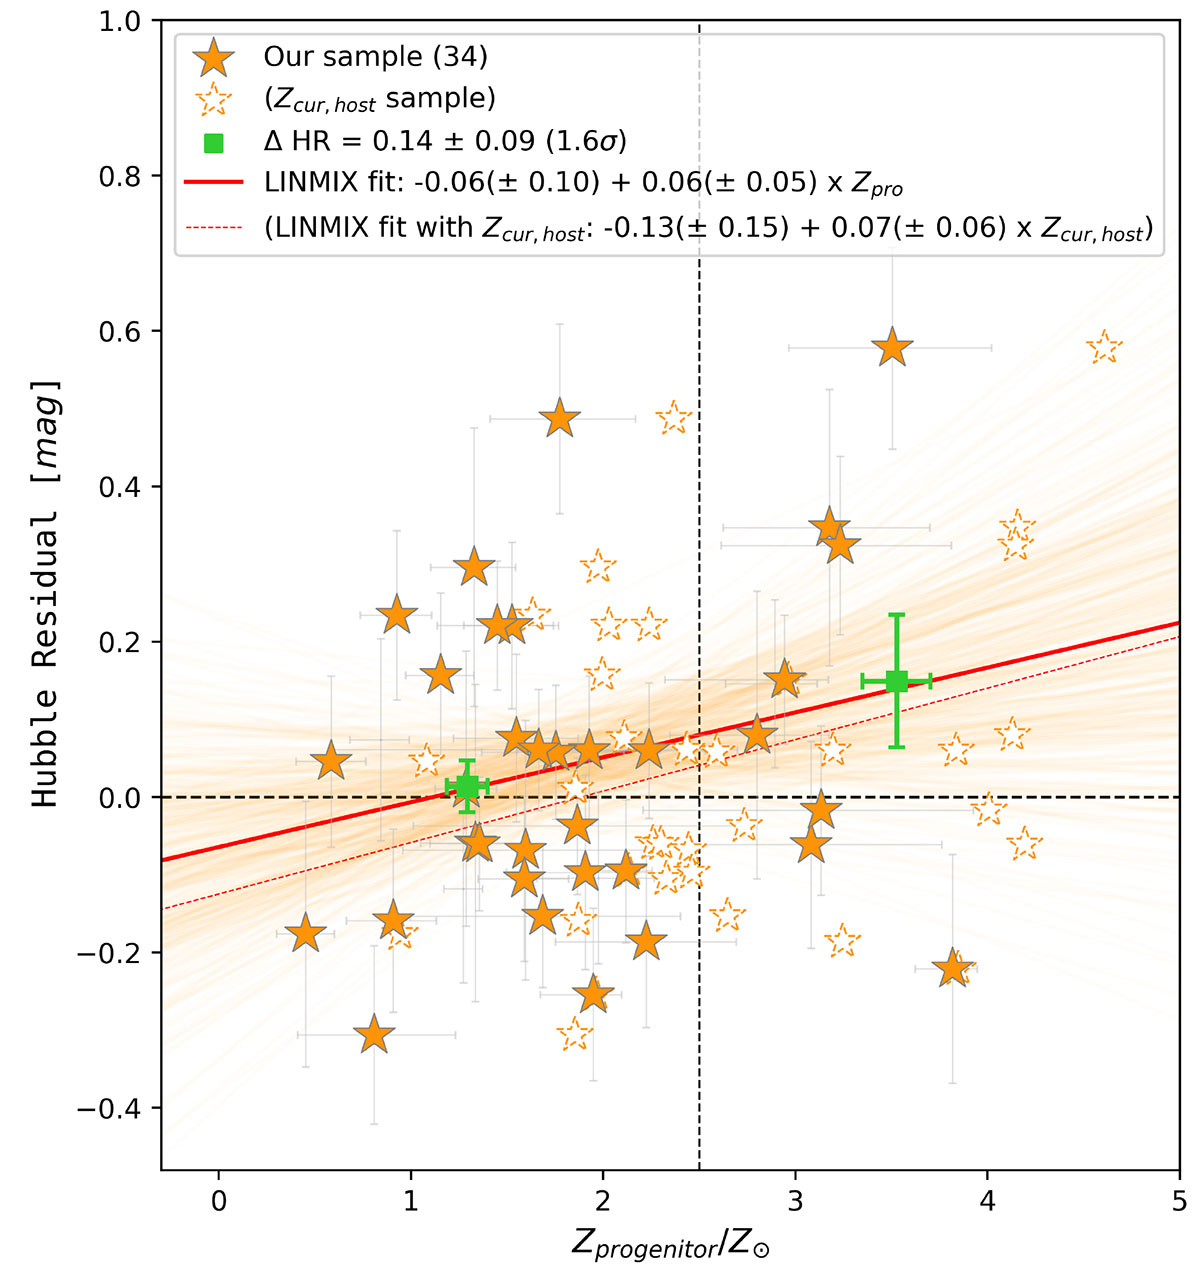
Fig. 4.
Download original image
Impact of Zprogenitor on the SN Ia corrected luminosity (i.e. the Hubble residual). Samples with Z of current host galaxies (Zcur, host) are also presented with empty stars. The average of 10 000 linear regression results (light red lines) from the LINMIX package is shown with the solid red line. The LINMIX fit with Zcur, host is indicated with the dashed red line. We split our sample at Zprogenitor = 2.5 (the vertical dashed line), where a gap is shown. The green squares are the weighted means of the HR in the different Zprogenitor group.
Current usage metrics show cumulative count of Article Views (full-text article views including HTML views, PDF and ePub downloads, according to the available data) and Abstracts Views on Vision4Press platform.
Data correspond to usage on the plateform after 2015. The current usage metrics is available 48-96 hours after online publication and is updated daily on week days.
Initial download of the metrics may take a while.