| Issue |
A&A
Volume 703, November 2025
|
|
|---|---|---|
| Article Number | A76 | |
| Number of page(s) | 13 | |
| Section | Interstellar and circumstellar matter | |
| DOI | https://doi.org/10.1051/0004-6361/202556014 | |
| Published online | 07 November 2025 | |
Asymmetric radiation in binary systems: Implications for disk evolution and chemistry
1
Univ. Grenoble Alpes, CNRS, IPAG,
38000
Grenoble,
France
2
School of Physics and Astronomy, Monash University,
Vic.
3800,
Australia
3
INAF, Osservatorio Astrofisico di Arcetri,
Largo E. Fermi 5,
50125
Firenze,
Italy
★ Corresponding author: This email address is being protected from spambots. You need JavaScript enabled to view it.
Received:
18
June
2025
Accepted:
15
September
2025
Abstract
Context. Current models of binary systems often depend on simplified approximations of the radiation field, which are unlikely to accurately capture the complexities of asymmetric environments.
Aims. We investigate the dynamical and chemical implications of a 3D asymmetric radiation field that accounts for the optical properties of sub-structures present in a protoplanetary disk, as well as the inclusion of a secondary radiation source in binary systems.
Methods. We conducted a series of 3D-SPH hydrodynamical simulations using Phantom, coupled with the 3D Monte Carlo radiative transfer code Mcfost, to compute disk temperatures on-the-fly. We explored different binary-disk orientations (0° and 30°) for an eccentric binary, along with a constant dust-to-gas ratio and dust as a mixture prescription. We also simulated an outburst event as an example of a drastic increase in luminosity.
Results. Heating from the secondary star inflates the outer disk, increasing the aspect ratio facing the companion by about 25% in inclined configurations compared to 10% in coplanar ones. Dust settling in the mid-plane enhances extinction along the disk plane, making the coplanar configuration cooler than the inclined one on the side of the disk facing the companion. Additional heating causes a shift in the snow line for species with freeze-out temperatures below 50 K, depending on the disk-binary inclination and binary phase. During outbursts, the aspect ratio doubles on the star-facing side and increases by 50% on the opposite side in inclined cases. The snow line shift would impact all the species considered in the outburst case.
Conclusions. Protoplanetary disk heating in binary systems depends on stellar properties, the binary phase, and disk local and global characteristics. This results in temperature asymmetries, especially during secondary star outbursts, leading to variations in aspect ratio and snow lines that can affect chemistry and planet formation.
Key words: astrochemistry / hydrodynamics / radiative transfer / methods: numerical / protoplanetary disks / binaries: general
© The Authors 2025
 Open Access article, published by EDP Sciences, under the terms of the Creative Commons Attribution License (https://creativecommons.org/licenses/by/4.0), which permits unrestricted use, distribution, and reproduction in any medium, provided the original work is properly cited.
This article is published in open access under the Subscribe to Open model. This email address is being protected from spambots. You need JavaScript enabled to view it. to support open access publication.
1 Introduction
Protoplanetary disks (PPDs) are circumstellar structures naturally formed during the early stages of star formation and composed of gas and dust. Disks are where planets form: solid dust particles collide and coagulate to form planetesimals, which can then grow through accretion into protoplanets and eventually full-fledged planetary bodies; the physical and chemical processes within the disk directly determine the formation pathways of planets and influence the architecture of the resulting planetary system (see for example Armitage 2018).
The environment plays an important role in the formation and evolution of PPDs. Star formation frequently occurs within dense clusters, leading to a high multiplicity of stellar systems (Duchêne & Kraus 2013; Reipurth et al. 2014). Binary stars are common, accounting for approximately one-third of all stellar systems, although this ratio varies with stellar properties (Raghavan et al. 2010; Tokovinin 2014, 2021; Offner et al. 2023). The presence of a second star modifies the environment surrounding a PPD, introducing asymmetries in the gravitational field and radiative heating. These perturbations can affect the structure, dynamics, and evolution of the PPD.
Protoplanetary disks in binary stellar systems exhibit diverse structures, broadly categorized into two main configurations. In circumstellar disks (CSDs), the disk orbits a single star, while in circumbinary disks (CBDs), the disk encircles both stars. The dynamic interplay between the binary and the PPD is sensitive to the binary’s properties, including the stellar masses, orbital separation, eccentricity, and inclination. These parameters influence the evolution and structure of the disk. In circumbinary disks, the effects include, but are not limited to, disk misalignments, the formation of eccentric cavities, the creation of dust over-densities, the generation of disk warps, and even significant disk breaking (Kley & Nelson 2008; Kley et al. 2008; Lodato & Price 2010; Nixon et al. 2013; Facchini et al. 2013; Dunhill et al. 2015; Ragusa et al. 2017; Poblete et al. 2019; Hirsh et al. 2020). Conversely, circumstellar disks in binary systems also experience dynamical perturbations. The gravitational pull from the companion star can shape the CSD via tidal truncation (Paczynski 1977), Lindblad resonances (Lindblad 1941), and von Zeipel-Kozai-Lidov oscillations (Martin et al. 2014; Fu et al. 2015; Franchini et al. 2019). A review of dust dynamics in disks in stellar binaries, along with a detailed catalog of imaged CSDs and CBDs, can be found in Zagaria et al. (2023) and Cuello et al. (2025), respectively.
Although progress has been made in modeling the dynamical interactions between binary systems and PPDs using hydrodynamic simulations (Artymowicz & Lubow 1994; Larwood et al. 1996), a common simplification is to assume an isothermal disk (e.g., Lodato & Price 2010; Hirsh et al. 2020), which neglects radiative heating and cooling processes within the disk. This simplification inaccurately predicts the disk’s thermal structure and its influence on other physical processes. For instance, Muley et al. (2024) recently studied the observational signatures of embedded planets in disks and Rowther et al. (2024) provided synthetic observations of a radiative-dominated circumbinary disk with the β-cooling prescription.
Accurately representing a disk’s temperature profile is critical for several reasons. Correctly estimating the disk’s vertical height relies on this temperature profile (Pringle 1981; Kenyon & Hartmann 1987; Chiang & Goldreich 1997), as does determining the location of snow lines. Snow lines mark the transition of given molecules from the gaseous state to solid ice. This phase transition affects the local volatile chemical concentration, impacting the building of planetary atmospheres (Öberg et al. 2011; Madhusudhan 2012; Cridland et al. 2020) and dust dynamics and growth (Gundlach & Blum 2015; Okuzumi & Tazaki 2019). Snow line positions are determined by the disk’s optical, thermal, and chemical properties and the stellar energy flux and are further modified by the presence of multiple stars. The snow line displacement can be observed during episodic stellar outbursts, which temporarily increase the stellar flux incident on the disk (Cieza et al. 2016; Lee et al. 2019). Stellar companions are often implicated in outbursting systems (Bonnell & Bastien 1992; Zurlo et al. 2024). Borchert et al. (2022a,b) modeled radiation-dominated disks in binary systems during FU Orionis-type outbursts, the most intense kind of episodic accretion events. They showed and characterized changes in the position of the water snow line.
This work investigates the influence of a secondary heating source on the physical structure of a radiation-dominated CSD. Specifically, it examines how considering the second star’s radiation in a binary system affects the disk’s vertical structure and temperature profile. This paper is structured as follows: Section 2 describes the numerical methods and parameters; Section 3 presents the findings; Section 4 offers a discussion of the results. Our conclusions are listed in Section 5.
2 Methods
We conducted a total of 14 three-dimensional hydrodynamical simulations of CSDs using the Phantom smoothed particle hydrodynamics (SPH) code (Price et al. 2018), along with on-the-fly radiation field calculations provided by Mcfost (Pinte et al. 2006, 2009). We performed two types of simulations: one involving pure gas SPH particles and the other treating dust particles using the dust one-fluid (or dust as a mixture) prescription (Laibe & Price 2014a,b; Price & Laibe 2015; Ballabio et al. 2018; Hutchison et al. 2018).
2.1 Basic framework of hydrodynamical and radiative computations
Phantom models the positions and velocities of gas particles using a Lagrangian approach by solving the equations:
![Mathematical equation: $\[\frac{\mathrm{d} \boldsymbol{v}}{\mathrm{~d} t}=-\frac{\nabla P}{\rho}+\Pi_{\mathrm{shock}}+\boldsymbol{a}_{\mathrm{ext}}+\boldsymbol{a}_{\mathrm{sink}},\]$](/articles/aa/full_html/2025/11/aa56014-25/aa56014-25-eq1.png) (1)
(1)
![Mathematical equation: $\[\frac{\mathrm{d} u}{\mathrm{~d} t}=\frac{P}{\rho^2} \frac{\mathrm{~d} \rho}{\mathrm{~d} t}+\Lambda_{\text {shock}},\]$](/articles/aa/full_html/2025/11/aa56014-25/aa56014-25-eq2.png) (2)
(2)
where v is velocity, u is specific internal energy, P is pressure, and ρ is density. The accelerations aext and asink correspond to external forces and sink particles, respectively. Dissipation terms Πshock and Λshock account for shock effects. Accurate velocity and energy variations depend on the equation of state (EOS), typically for an ideal gas:
![Mathematical equation: $\[P=(\gamma-1) \rho u,\]$](/articles/aa/full_html/2025/11/aa56014-25/aa56014-25-eq3.png) (3)
(3)
with γ as the adiabatic index. In practice, temperature can be related to internal energy from the ideal gas law, giving
![Mathematical equation: $\[T_{\mathrm{gas}}=\frac{\mu m_H(\gamma-1)}{k_{\mathrm{B}}} u,\]$](/articles/aa/full_html/2025/11/aa56014-25/aa56014-25-eq4.png) (4)
(4)
where μ = 2.38 is the assumed mean molecular weight appropriate to a disk consisting mostly of molecular hydrogen, mH is the atomic mass of Hydrogen, and kB is the Boltzmann constant. Assuming an isothermal distribution simplifies the temperature and internal energy profiles so they only depend on radius, centered on the primary heating source. However, this neglects the disk’s optical, thermal, and chemical properties, which is problematic in systems with multiple heating sources, such as binaries.
Mcfost is a 3D Monte Carlo radiative transfer code that divides the space into Voronoi cells centered on SPH particles, with physical properties constant within each cell. Radiation is modeled via photon packets originating from star and dust thermal emission, which interact with the medium through scattering, absorption, or re-emission. Dust optical properties are derived from Mie theory, assuming spherical, homogeneous grains, with opacities computed by integrating over grain size distributions. Under local thermodynamic equilibrium (LTE), the cell’s temperature, Ti, is derived via the mean intensity approach (Lucy 1999):
![Mathematical equation: $\[\int_0^{\infty} \kappa_i^{\mathrm{abs}}(\lambda) B_\lambda\left(T_i\right) \mathrm{d} \lambda=\frac{L_{\mathrm{star}}}{4 \pi V_i N_\gamma} \sum_{\lambda, \gamma} \kappa_i^{\mathrm{abs}}(\lambda) \Delta l_\gamma+\Lambda_{\mathrm{heat}},\]$](/articles/aa/full_html/2025/11/aa56014-25/aa56014-25-eq5.png) (5)
(5)
where ![Mathematical equation: $\[\kappa_{i}^{\text {abs}}\]$](/articles/aa/full_html/2025/11/aa56014-25/aa56014-25-eq6.png) is the cell’s opacity, Bλ is the blackbody intensity, Lstar the stellar luminosity, Vi the cell volume, Nγ photon packets, Δlγ is the distance over which a single photon travels before being extinguished, and Λheat additional heating mechanisms. This process allows Mcfost to iteratively compute the dust temperature distribution accounting for complex interactions within the disk. We then assumed the dust temperature is equal to the gas temperature in order to update the internal energy of the gas in Phantom by inverting Eq. (4).
is the cell’s opacity, Bλ is the blackbody intensity, Lstar the stellar luminosity, Vi the cell volume, Nγ photon packets, Δlγ is the distance over which a single photon travels before being extinguished, and Λheat additional heating mechanisms. This process allows Mcfost to iteratively compute the dust temperature distribution accounting for complex interactions within the disk. We then assumed the dust temperature is equal to the gas temperature in order to update the internal energy of the gas in Phantom by inverting Eq. (4).
2.2 Simulation setup
We conducted 14 simulations for different stellar parameters, binary-disk inclinations, and disk-thermal prescriptions. The simulation architecture consists of a stellar binary system where the primary star hosts a circumstellar disk. We modeled the two stars as sink particles (Bate et al. 1995), with accretion radii set to 1 au for both. All binary systems started with a semi-major axis of 50 au and an eccentricity of 0.5. For each configuration, we explored two inclination angles relative to the circumstellar disk: a coplanar (0°) and an inclined case (30°). We considered two binary mass ratios (q): one for an equal-mass binary system (q = 1) composed of twin Sun-like stars, and another with q = 0.5, which involves a primary Sun-like star and a secondary star with half its mass. We used standard Sun-like stellar parameters and assumed main-sequence stars to derive their effective temperatures and radii for all 1.0 M⊙ stars. For all 0.5 M⊙ secondary stars, we similarly assumed main-sequence characteristics consistent with red dwarf stars (Boyajian et al. 2012; Baraffe et al. 2015). The simulation Bin-q05 represents a binary system where the secondary star remains in a quiescent state throughout the run, whereas FU-Bin-q05 models an outbursting secondary. The latter setup was constructed by only modifying the stellar radiative properties of the companion at the end of the Bin-q05 simulation, thereby preserving the same evolutionary and dynamical configurations of both stars and the disk. In order to create the outbursting state (luminosity increase), we artificially modified the stellar radius (Rstar) of the secondary star while maintaining a constant effective temperature. The change in radius will only affect the radiative calculations in Mcfost in two aspects: (i) it will increase the bolometric stellar luminosity up to 30 L⊙ without altering the stellar spectrum, as the effective temperature remains constant, and (ii) the starting point of the photon packets will now be set at a new distance of Rstar. Table 1 summarizes all the parameters considered in our simulations.
The outburst events are associated with an increase in the star’s accretion rate (see the review Fischer et al. 2023) and are known to have diverse origins (Vorobyov et al. 2021). We assumed that the most likely point for the companion to trigger an outburst is at pericenter as Bonnell & Bastien (1992) suggest, where it experiences a rise in its accretion rate (see also figure 5 of Poblete et al. 2020). Therefore, we force the luminosity change to occur at pericenter by the end of the evolution of Bin-q05. As we are mainly interested in the immediate effect of the outburst on the disk, we model the high luminosity phase during a couple of decades only.
The gas disk is initialized with Nsph SPH particles in Keplerian rotation and is irradiated by Nγ photon packets emitted from both stars, with each emission occurring at intervals of Δtγ, corresponding to the timestep between Mcfost calls (see Table 1). The total number of photon packets is distributed between the two stars weighted by their luminosities. The explanation for the heterogeneous Nγ values will be discussed further in Section 2.3. The initial gas surface density and temperature profiles follow
![Mathematical equation: $\[\Sigma(r)=\Sigma_0\left(\frac{r}{r_0}\right)^{-p_1}\left(1-\sqrt{\frac{r_{\min }}{r}}\right) \underbrace{\left(1-\exp \left\{r-r_{\max }\right\}\right)}_{\text {outer taper}},\]$](/articles/aa/full_html/2025/11/aa56014-25/aa56014-25-eq7.png) (6)
(6)
![Mathematical equation: $\[T(r)=T_0\left(\frac{r}{r_0}\right)^{-2 p_2},\]$](/articles/aa/full_html/2025/11/aa56014-25/aa56014-25-eq8.png) (7)
(7)
using the values in Table 2. Exponentially tapering the outer edge of the disk in Dust-Bin-q1 results in negative gas-to-dust ratios. Therefore and for direct comparison, the disks in both NT-Bin-q1 and Dust-Bin-q1 were not exponentially tapered at the outer edge. We note that, by omitting the taper and using a fixed Σ0 at r0 and disk radius, these disks are roughly 13% more massive than the other simulations. We initially set the disk’s temperature profile to be vertically isothermal for all simulations, following a power law that results in an aspect ratio of H/r = 0.05 at any radius. Also, we set the SPH viscosity parameter αAV = 0.13, which corresponds to a mean Shakura-Sunyaev disk viscosity (Shakura & Sunyaev 1973) of αSS ≈ 5 × 10⁻³ (cf. Lodato & Price 2010).
We explore three thermal-disk prescriptions:
Radially isothermal: the temperature only depends on the radial distance following Equation (7).
Radiative dust-free: the temperature is set by Mcfost assuming a constant gas-to-dust ratio of 100 in the gas density profile provided by Phantom. We use the Mie theory for dust grains and we consider 100 different grain species that follow a grain-size distribution by following a power law dn/ds ∝ s−3.5 between 0.03 μm and 1 mm.
Radiative one-fluid dust: the temperature is set by Mcfost with dust distribution given by Phantom. The dust disk is initialized equal to the gas disk. We consider three dust species s1, s2, and s3, in the limit of dust diffusion as presented in Hutchison et al. (2018) and Ballabio et al. (2018). See Dusty disk in Table 2.
In the radiative dust-free and one-fluid dust prescriptions, the dust composition is assumed to be mainly silicates. We evolve the simulations until they reach 10 binary orbits, corresponding to ≈2500 years for Bin-q 1 and ≈2700 years for Bin-q05. Finally, we set the frequency for updating temperatures in Phantom to 100 times per binary orbit during the whole simulation. This corresponds to an Mcfost call every Δtγ = {2.5, 2.8} years for Bin-q 1 and Bin-q05, respectively.
Simulation setups.
Disk parameters utilized in constructing the simulation.
2.3 Coupling and limitations between Phantom and Mcfost
Phantom computes the evolution of the hydrodynamic variables in our simulations, while Mcfost calculates the whole radiation field and resulting temperature profiles. In our simulations, Phantom initialized an isothermal vertical profile and provided the positions of the sink and SPH particles to Mcfost. Depending on the dust prescription, the dust content in each Voronoi cell was either set via a fixed gas-to-dust ratio value or derived from Phantom outputs. Mcfost required a stellar spectrum and radius to define the photon packets’ properties. These photon packets were propagated in the disk to get the temperature structure, which was then returned to Phantom to update hydrodynamics (explained in detail in Pinte et al. 2019; Nealon et al. 2020), as summarized in Figure 1. Cells evolved adiabatically between Mcfost calls (i.e., every Δtγ), allowing for adiabatic work. Unlike (Borchert et al. 2022a,b), we did not model accretion luminosity, so temperature changes depended solely on stellar position, luminosity, adiabatic work, and disk properties.
Our modeling required frequent radiative transfer calls to compute hydrodynamics accurately, ensuring (i) that the dynamical time exceeds the interval between temperature updates (see Rowther et al. 2024), and (ii) that temperature shifts caused by the secondary star’s movement relative to the disk’s outer edge are minimized. The chosen timestep Δtγ allowed particles at ≈2 au to complete one orbit around the primary star before their temperatures were recalculated by Mcfost; meanwhile, at rmax, the temperature was updated 25 times along a local particle’s orbit.
Finally, insufficient photons can lead to artifacts due to non-converging cell temperatures. This issue presents itself in two ways: (i) cells without any energy heating default to a temperature of 1 K, and (ii) cell temperatures fail to converge. Both factors risk causing unphysical collapse and fragmentation. Dense regions where photons cannot penetrate are especially prone. To prevent this, we utilize a large, variable number of photons and monitor the simulation, increasing photon packets in dense mid-plane areas as necessary. For example, we change the value Nγ/Nsph = 1400 in NT-Bin-q1 up to a ratio of 4000 in Dust-Bin-q1 to ensure proper irradiation in the one-fluid simulation while keeping computational costs manageable.
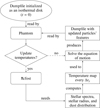 |
Fig. 1 Flowchart illustrating the coupling between the SPH code Phantom and the radiative transfer code Mcfost. An ellipse represents the initial process, the main processes are shown in rectangles, and the decision node is depicted as a diamond. |
3 Results
To clearly visualize the asymmetric heating effects of the secondary star on the circumprimary disk, our simulations use a re-oriented coordinate system. The disk’s angular momentum vector is aligned perpendicular to the xy plane, and the secondary star’s orbit is constrained to a co-rotational frame; the companion’s movement is confined to the x axis and the plane y = 0 for the coplanar and inclined configuration, respectively. A new radial coordinate, r′, is defined based on the standard cylindrical radial coordinate, r, to facilitate analysis within this re-oriented framework. The new radial coordinate is defined as a function of the distance between a given particle within the disk and the secondary star’s position as follows:
![Mathematical equation: $\[r^{\prime}(r)=\left\{\begin{array}{cl}-r, & \begin{array}{}\text {if it is located within the half of the disk nearest} \\\text {to the star,}\end{array} \\r, & \begin{array}{}\text {if it is located within the half of the disk farthest} \\\text {to the star.}\end{array}\end{array}\right.\]$](/articles/aa/full_html/2025/11/aa56014-25/aa56014-25-eq9.png) (8)
(8)
Section 3.1 compares results from Iso-Bin-q1, OS-Bin-q1, and Bin-q1 simulations. Section 3.2 compares the dust prescriptions represented by NT-Bin-q1 and Dust-Bin-q1 simulations. Finally, the impact of an outburst from the secondary on the CSD is explored in Section 3.3 based on the Bin-q05 and FU-Bin-q05 simulations. For each of the previous cases, we also investigated the effect of the two misaligned binary-disk configurations (0° and 30°).
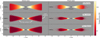 |
Fig. 2 Temperature distributions of SPH particles (in the Phantom dumpfile) in the CSD are shown in the r′z plane for three heating scenarios: (top) vertically isothermal; (middle) irradiation from the primary star only; and (bottom) irradiation from both stars. These correspond to the Iso-Bin-q1, OS-Bin-q1, and Bin-q1 simulations, respectively. The left and right columns show the simulation’s initial and final states. A black star marks the primary star’s position, while a black arrow points to the secondary star. |
3.1 Isothermal versus radiative-dominated disk
3.1.1 Radial and vertical profiles
Figures 2 and 3 offer a visual comparison of temperature distributions within the CSD, illustrating results from different heating scenarios for coplanar and inclined binary configurations, respectively. In both figures, the radiative simulations with Mcfost (OS-Bin-q1 and Bin-q1) reveal vertical thermal stratification caused by density-dependent extinction, with denser mid-plane regions being cooler than surface layers. This behavior contrasts with the isothermal model (Iso-Bin-q1), which does not incorporate the density-temperature coupling and therefore lacks such vertical temperature variation. Figure 4 illustrates the differences in temperature, aspect ratio, and surface density profiles when radiative temperature calculations are applied to both coplanar and inclined binary systems. As in the temperature maps, they reveal significant differences between the radiative and isothermal models. We calculated the scale height (H) by fitting Gaussian profiles to the vertical density structure at different disk radii, such as ρ(z) ∝ exp(−z2/2H2).
Including radiation from the secondary star causes asymmetries in the disk’s temperature distribution in the outer regions compared to the OS-Bin-q1 simulation, where only the primary star heats the disk. In the coplanar setup, the side nearest to the companion experiences an approximate 4 K temperature increase, while the farthest side rises by 2 K, both representing about 10% increases over the one-source case. In the inclined setup, these differences become more pronounced: the closest side heats up by as much as 12 K, and the farthest side by 6 K, corresponding to relative increases of nearly 35% and 20%, respectively. These findings indicate that in inclined systems, the secondary star’s radiation more effectively penetrates both the inner and outer regions of the disk. Conversely, in the coplanar scenario, the dense mid-plane greatly absorbs the secondary’s radiation, limiting its thermal influence on the disk.
Radiative disks exhibit a reduced aspect ratio compared to isothermal disks, a direct consequence of their adjustment to maintain hydrostatic equilibrium. This is evident in the decrease from an initial H/r value of 0.05 to approximately 0.03 between 4 and 8 au. In contrast, the isothermal model, by construction, is already in hydrostatic equilibrium, precluding any such later adjustment in aspect ratio. In the isothermal model, changes in the vertical structure are confined to the inner and outer disk rims, where interactions with stars are most pronounced, leading to a decrease in surface density. As we derived the aspect ratio from the vertical density profile, it is dependent on temperature and density. Consequently, these rims exhibit increased H/r values due to constant temperature, as less material supports the initial vertical profile, resulting in local thickening.
The binary’s inclination impacts the disk’s vertical structure. In coplanar configurations, the secondary star’s radiation primarily heats the near side of the disk, resulting in only a ~10% increase in the H/r value in this region when comparing one-source and two-source heating models. The far side shows negligible change. Conversely, the rise in the H/r value is considerably larger in inclined systems: approximately 25% on the near side and 10% on the far side. Furthermore, the ability of the secondary star’s radiation to penetrate and heat the far side of the disk more effectively in inclined systems leads to an increase in contrast between the borders and the middle disk vertical structure. These differences highlight the critical role of the secondary star’s radiation in shaping the vertical structure of the disk, particularly in inclined binary-disk systems, as discussed above for the temperature.
Finally, radiative disks have regions that are denser than those of their isothermal counterparts. These disks show a density concentration toward the central regions, with densities decreasing in both the inner and outer rims. In the simulations, approximately 90% of the circumprimary disk mass is contained within a radius of about 7 au in both coplanar and inclined cases. However, the isothermal simulations contain 45% more material within 3 au than the radiative simulations, which reduces to 15% at 4 au, with both models enclosing the same amount of material by 7 au. While this might initially suggest a dominant role for radiative pressure in shaping this radial profile, especially from the secondary star, the one-source and two-source simulations exhibit this same compact radial profile, discarding such a role. This indicates that radiative pressure effects do not primarily drive the density profile but rather the different temperature profiles inherent to radiative models.
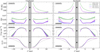 |
Fig. 4 Median radial profile of disk density-weighted average temperatures (first row), aspect ratio (H/r, second row), surface density (Σ, third row), and the normalized surface density cumulative integral (Σ CI, fourth row) for a coplanar (left) and inclined by 30° (right). Each panel compares simulations with a vertically isothermal temperature profile (Iso-Bin-q1 in green), a one-star heating model (OS-Bin-q1 in blue), and a two-star heating model (Bin-q1 in magenta). Solid lines represent the median values along one binary orbit (between the ninth and tenth), while the shaded colored regions illustrate the median absolute deviation. The shaded gray areas denote the primary star’s accretion radius. The black arrow indicates the location of the companion star. The dotted line in the second, third, and fourth rows depicts the initial values for the H/r, surface density profiles, and the normalized surface density cumulative integral, respectively. |
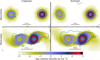 |
Fig. 5 Column density maps of circumstellar disks in coplanar (left) and inclined (right) binary systems at the apocenter (top) and pericenter (bottom), viewed face-on with respect to the circumprimary disk in Bin-q1. The evolutionary time at the pericenter and apocenter corresponds to 9.5 and 10 binary orbits, respectively. Contours depict approximate density-weighted average temperatures along the line of sight for the H2O (white), NH3 (cyan), and CO2 (black) snow lines at 130 K, 80 K, and 50 K, respectively. The green area represents temperatures below 30 K, visible only in the lower-left panel for these configurations, which traces the CO and N2 snowlines. |
3.1.2 Evolution of the snow line position
We defined the snow line as the isothermal contour in our density-weighted average temperature maps that matches the freeze-out temperature of a specific molecular species. The complete derivation of the freeze-out temperatures for the molecules considered is provided in Appendix A. Figure 5 illustrates the changes in the predicted snow lines for H2O (120 K), NH3 (80 K), CO2 (50 K), CO (30 K), and N2 (30 K) at maximum and minimum stellar separations (pericenter and apocenter respectively) for the Bin-q1 case. We selected H2O, CO, and N2 due to their crucial roles as major volatile carriers in the chemical reactions involving oxygen, carbon, and nitrogen within PPDs (Öberg & Bergin 2021); they regulate the carbon-to-oxygen (C/O) and nitrogen-to-oxygen (N/O) ratios in both gas and solid phases throughout the disk. Additionally, we include CO2 and NH3, which are components of the ice and also influence these ratios (Boogert et al. 2015; McClure et al. 2023). While we currently employ a single-value approximation for binding energies, we acknowledge that recent theoretical and experimental works (e.g., Minissale et al. 2022; Ferrero et al. 2020) point toward a distribution that can substantially affect snowline location and gas-phase molecular abundance (Tinacci et al. 2023; Boitard-Crépeau et al. 2025), indicating the need to consider binding energy distributions in future models.
The positions of the snow lines are influenced by both the binary system’s orbital phase and the inclination of the disk in relation to the binary’s orbital plane. Although the secondary star initially does not possess its own circumstellar disk, tidal forces truncate the primary’s disk at approximately ~6 au (see Pichardo et al. 2005; Miranda & Lai 2015), redistributing material to create a less massive disk around the secondary star. This leads to a more extended H2O and NH3 snow lines surrounding the secondary star, given that both stars share the same stellar characteristics. The binary gravitational pull is expected to render both disks eccentric, as observed in our simulations. Although the duration of the simulations in our study is too short to make definitive statements about the long-term evolution of the disk structure, it is important to note that if the disk becomes eccentric, the snow lines will also naturally assume an eccentric shape. For instance, the H2O snow line in the coplanar configuration exhibits eccentricities of 0.06 at apocenter and 0.07 at pericenter. In contrast, the inclined configuration shows an eccentricity of 0.06 at apocenter but a reduced value of 0.02 at pericenter. However, the relatively high temperature (120 K) of the H2O snow line makes its position less sensitive to changes in binary-disk inclination within the parameters considered in these simulations, keeping its location close to the stars. Conversely, a larger luminosity ratio favoring the secondary star or a less massive circumprimary disk could significantly affect the position of the H2O snow line. Such an inclination-shift dependence is more readily visible for the CO2 snowline. The CO2 snow line in these simulations closely follows regions of high optical depth, indicating areas with sufficiently dense gas to maintain low temperatures. This snow line is mainly observed around the circumprimary disk.
Coplanar configurations maximize optical depth along the disk-plane for the secondary star’s radiation, resulting in less efficient heating of the circumprimary disk compared to inclined configurations. Consequently, the coplanar simulations display the coldest disk temperatures (<30 K). The companion star’s gravitational influence at the pericenter triggers prominent gas spiral arms. The CO2 snow line then traces these spirals, encompassing regions with the lowest temperatures below 30 K on the opposite side of the companion’s location, indicating frozen CO and N2. Although the spiral arm nearest the companion star is denser, it experiences more significant heating from the companion, slightly pushing the snow line back. In contrast, the CO2 snow line remains nearly symmetric and mildly eccentric around the primary star at pericenter, within an inner radius lower than 7 au. However, in the inclined case, several azimuthal directions facing the companion reach temperatures exceeding 50 K, causing the CO2 snow line to lose its radial symmetry across all radii. Figure 6 shows this asymmetric profile; it shows a temperature difference of almost 15 K between the disk’s two sides at pericenter in the inclined configuration, which largely explains the shape of the CO2 snow line.
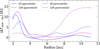 |
Fig. 6 Density-weighted average temperature difference between the near and far sides of the disk in the Bin-q1 simulation shown as a function of radius for both the coplanar (blue) and inclined (magenta) configurations. The solid lines indicate the apocenter position of the binary orbit, while the dash-dotted lines correspond to the pericenter. |
3.2 Effects of dust settling on the mid-plane
In contrast to the dust-free simulation (NT-Bin-q1), the one-fluid dust simulation (Dust-Bin-q1) does not assume a constant dust-to-gas ratio for all the considered evolutionary time; rather, it explicitly models dust evolution, with dust settling toward the mid-plane as expected (Price & Laibe 2015; Hutchison et al. 2018). The accumulation of dust at the disk mid-plane increases the optical depth and reduces the temperature, consequently decreasing the aspect ratio, as is illustrated in Figure 7.
The change in aspect ratio is a function of binary inclination. In the coplanar Dust-Bin-q1 case, the reduction is notably more pronounced on the side opposite the companion star, displaying a decrease of approximately 15% compared to the NT-Bin-q1 simulation. The companion’s heating causes a comparatively higher aspect ratio on the side facing it. Thus, the difference in aspect ratio progressively increases between these two sides from nearer to farther side to the companion (in regions with |r′| > 3 au) because the far side is not affected by the companion’s radiation (see Figure 4).
In the inclined Dust-Bin-q1 case, aspect ratio variations stay below 5%. The most significant decreases in aspect ratio occur at the location of the dust inner rim (~3 au), a feature also observed in the coplanar Dust-Bin-q1 simulation. This aligns with a dust-dense region where the temperature is expected to be lower. The disk side facing the companion presents the same aspect ratio between the two dust prescriptions. This indicates that the settled mid-plane dust primarily contributes to extinguishing all radiation penetrating along the disk mid-plane direction, consistent with the optical depth behavior.
3.3 Unequal mass binary and outburst event
Figure 8 presents a comparison similar to that of Figure 5, but specifically for Bin-q05 and FU-Bin-q05. Given that the binary mass ratio is 0.5, the truncation radius for the CSD is larger than that of Bin-q1, allowing more material from the CSD to remain bound to the primary star. This increases the disk’s optical thickness, which, together with a less luminous companion, results in an overall colder disk. This phenomenon is evident in both the coplanar and inclined configurations, where the outermost disk regions exhibit temperatures below 30 K, which we have defined as green areas, during the apocenter binary phase. In contrast to the inclined Bin-q1 simulation at apocenter, the CSD in inclined Bin-q05 shows that the isothermal lines for 30 K and 50 K are more extended toward the location of the companion star and narrower on the opposite disk side. This thermal structure can be attributed to the low luminosity of the companion. Despite the presence of a moderate level of disk eccentricity, similar to that in Bin-q1, the companion’s luminosity, approximately 30 times less than that of the primary star, prevents it from effectively heating the outer regions of the CSD.
During the pericenter binary phase in the coplanar Bin-q05 simulation, the green areas are not only more prominent but also extend into another disk sector. In the inclined setup, the green region appears in the same location as in the coplanar Bin-q1 case but is slightly larger. Additionally, the CO2 snow line remains continuous azimuthally, unlike the discontinuities observed in inclined Bin-q1. These results underscore the importance of the disk’s optical properties, in conjunction with the stellar properties, in determining the disk thermal structure.
The bottom row of Figure 8 depicts the effects of the outbursting companion represented with the FU-Bin-q05 simulation. The abrupt increase in the companion’s luminosity significantly changes the temperature profile of the entire CSD of the primary star.
In the coplanar FU-Bin-q05 simulation, the H2O and NH3 snow lines shift from an initial position near the secondary star (pre-outburst) to the outer regions of the primary CSD. The CO2 snow line experiences a change similar to that seen in inclined Bin-q1 at pericenter; it loses its azimuthal symmetry, with the areas facing the companion heating to temperatures exceeding 50 K. Notably, the NH3 and CO2 snow lines display comparable behavior in both coplanar FU-Bin-q05 and inclined Bin-q1 cases. This indicates that an inclined binary can cause similar heating effects in a disk as a coplanar disk undergoing external heating due to a stellar outburst for certain isothermal lines. On the other hand, in the inclined FU-Bin-q05 simulation, the disk’s temperature exceeds 50 K, indicating the complete sublimation of CO2. Additionally, the shape of the NH3 snow line closely resembles that of the CO2 snow line in the coplanar FU-Bin-q05 simulation.
Figure 9 depicts the dynamical aftermath of the outburst over the disk. The curves represent the median value for 43 years following the outburst, instead of the entire orbit as shown in Figure 4. In both coplanar and inclined FU-Bin-q05 simulations, the disk’s side facing the companion experiences a 100% increase in the aspect ratio value compared to the pre-outburst value. The opposite side of the disk experiences variation in regions with r′ < 10 au of no more than 20% for the coplanar setup. In the inclined case, however, the aspect ratio increases by up to 50%.
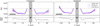 |
Fig. 7 Disk aspect ratio profiles and relative variations from NT-Bin-q1 (blue) and Dust-Bin-q1 (magenta) simulations for the Bin-q1 case. The bottom panels quantify the relative difference in aspect ratio, Δ(H/r), between these two simulations, normalized to the aspect ratio from the dust-free simulation, (H/r)0. |
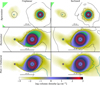 |
Fig. 8 Column density maps of circumstellar disks for Bin-q05 and FU-Bin-q05, labeled similarly to Figure 5. The green area represents temperatures below 30 K. The upper and middle rows illustrate the disk morphology of Bin-q05 at apocenter and pericenter, respectively. The bottom row depicts the same evolutionary time shown in the middle row, but for the outbursting companion star: FU-Bin-q05. The secondary star is not depicted for easy visualization of its circumstellar disk. |
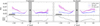 |
Fig. 9 Figure compares the disk aspect ratio profile for Bin-q05 (blue) and FU-Bin-q05 (magenta). The bottom panels quantify the relative differences between these two quantities across the two simulations, normalized to the values obtained from Bin-q 05. |
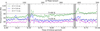 |
Fig. 10 Temperature evolution for the inclined Bin-q1 simulation, along the two final binary orbits for three SPH particles, which represent different mean radial distances: 3.4 au (green), 5.8 au (blue), and 7.3 au (magenta). The vertical gray areas highlight the pericenter phase of the binary system, while the horizontal dashed lines indicate two specific temperature values. |
4 Discussion
This new Phantom-Mcfost implementation allowed us to explore the radiative feedback and circumstellar disk morphology induced by a bound stellar companion. Our results highlight the importance of accounting for radiative processes, as they affect two main areas: dynamical behavior and astrochemical evolution. These aspects play a crucial role in imprinting observable features within binary stellar systems.
The aspect ratio affects grain growth and planetary migration (Brauer et al. 2008). Despite the rapid accretion of gas and dust from the CSD into the primary star (Monin et al. 2007), the presence of a CBD can act as a reservoir of material to replenish the CSD (Nelson & Marzari 2016; Marzari & D’Angelo 2025). In these long-lived CSDs, dust grains can evolve not only under the companion’s gravitational influence but also due to its radiative effects. When planets finally form, their evolution remains connected to the H/r value through the disk’s torque (see Paardekooper et al. 2023). Then, an asymmetric aspect ratio along a fixed radial distance will lead to differential migration rates along the planetary orbit.
Shifting snow lines influence the availability of key species in both the gas and solid phases, directly impacting the C/O and N/O ratios in various disk regions. These changes in chemical abundances can affect the formation and composition of planetesimals and, ultimately, the atmospheres of emerging planets (Öberg et al. 2011; Öberg & Bergin 2016; Booth et al. 2017; Madhusudhan 2019). For instance, the increased heating from the secondary star in inclined systems may lead to the sublimation of volatile compounds from dust grains, enriching the gas phase and altering the overall chemical environment. Furthermore, the presence of spiral arms induced by the companion star can create localized areas of high density and temperature gradients. The sublimation of molecules in the gas phase alters the distribution of pre-existing species and promotes the formation of interstellar complex organic molecules (COMs; Herbst & van Dishoeck 2009; Ceccarelli et al. 2023).
The additional heating from the secondary star and the periodical formation of spiral arms affect the CSD evolution. This translates into thermal cycles where particles undergo phases of high temperatures (at pericenter) and maintain a relatively constant low temperature during the rest of the binary orbit. Figure 10 illustrates the temperature modulation for three representative SPH particles located at different radii in the inclined Bin-q1 simulation. Note that the peak temperature is shifted from the binary’s pericenter due to the particle’s differential rotation, as explained in Section 2.3. Typically, PPDs around late Class I or Class II single stars exhibit a lack of emission in COMs due to their cooler disks compared to their Class 0 or early Class I counterparts (Artur de la Villarmois et al. 2019; van’t Hoff et al. 2020). This limitation can be alleviated by considering the heating caused by a companion star, particularly relevant in inclined configurations, as discussed in Section 3.1.2. Therefore, binary systems present a valuable opportunity to explore volatile molecules in evolved systems. Specifically, binary systems may act as a significant source of abundant COM emissions in late Class I or Class II stars, contrasting with single stellar systems, where COMs are typically frozen onto ice grains due to lower temperatures.
Although fluctuations in particle temperature correlate with the companion’s position, this behavior is primarily driven by the LTE assumption in the cell temperature calculation. Sublimation of species from dust grains occurs nearly instantaneously when sufficient energy is supplied. However, freeze-out or adsorption, the process of converting volatile species back to ice, exhibits a delay following luminosity changes, as reported by Lee et al. (2025). Consequently, particles can remain in the gaseous phase even after the luminosity source has passed. Appendix A outlines the relationship between the freeze-out timescale and the disk’s local conditions. In our simulations, the number density of hydrogen nuclei (nH) in the CSD mid-plane is approximately 1012 cm−3, resulting in a freeze-out timescale of slightly more than two days for CO2 according to Equation A.1. Even applying a decrease of three orders of magnitude for the value of nH, the freeze-out timescale remains below 10 years. Therefore, this astrochemical process could be readily traced on timescales from days to years. Similar to the B335 system, binary stars may provide another potential natural laboratory for astrochemistry (Lee et al. 2025).
To observe this process, binary systems should possess partially resolved CSDs that enable the detection of azimuthal intensity variations. Although larger CSDs are easier to characterize, they often signify distant companions with long orbital periods. We emphasize the complex interplay of stellar parameters, as disk size is dependent on the binary mass ratio (Pichardo et al. 2005), and stellar mass affects the star’s temperature. The key parameters of the companion include its luminosity, inclination, and proximity to the disk. Our results indicate that temperature variations are observable in disks approximately 10 au in radius around Sun-like stars, especially in inclined configurations. Additionally, binary-disk inclination tends to lead to radial disk widening, with the most pronounced effects observed in retrograde orbits (Miranda & Lai 2015). Following these and our findings, binaries with similar stellar masses, semi-major axes less than ~50 au, and eccentricities below 0.5, featuring bright and inclined companions, would be favorable targets for studying volatile molecules across binary phases.
Finally, the age of the binary system also affects the thermal structure of the disk. In the Class 0 or early Class I phase, the surrounding envelope both heats the system and shields the disks from direct irradiation by the companion, while abundant material leads to frequent outbursts. As the envelope dissipates in later stages, stellar luminosity and disk mass decline, and the disks become directly exposed to irradiation, resulting in thermal patterns that differ from those in the embedded phase. The outburst event driven by episodic accretion amplifies the thermal influence of the companion star on the CSD, with FU-Orionis and EXor types being the most characteristic (Hartmann & Kenyon 1996; Audard et al. 2014). Binary stars increase the likelihood of these outbursts at the pericenter, particularly when they exhibit eccentricity (Bonnell & Bastien 1992); the disks surrounding both stars develop spiral waves that trigger accretion onto the stars (Vorobyov & Basu 2005). Although both stars can undergo accretion, an outburst from an inclined secondary relative to the CSD will cause the most significant changes in the chemical structure of the disk. Additionally, Ros & Johansen (2024) investigated planetesimal formation and growth under the influence of stellar outbursts, demonstrating efficient grain growth up to centimetre sizes. Consequently, the periodic behavior of the binary system in triggering outbursts at pericenter could enhance the formation of planetesimals.
5 Conclusion
We conducted hydrodynamic simulations of a CSD under the gravitational and radiative influence of a stellar binary system. We explored various disk-binary orientations, binary mass ratios, and dust prescriptions, and we simulated an FU-Orionis-type outburst in the secondary star. Our results reveal a strong dependence among the properties of the PPD, stellar characteristics, disk-binary inclination, and binary orbital phase in heating different regions of the disk. These are our main findings:
The addition of a radiative transfer solver in a 3D hydrodynamical simulation enhances the temperature profile of the PPD by considering the disk’s optical, thermal, and chemical properties alongside the stellar properties. Consequently, the efficiency of dust settling becomes an important factor in determining the extinction levels along the disk mid-plane;
The inclusion of a secondary star introduces significant asymmetries in disk temperature profiles, affecting both the vertical structure and the locations of the snow lines. The disk-binary inclination and binary phase strongly modulate the disk’s temperature profile, with inclined configurations efficiently heating the disk mid-plane. The outburst amplifies the radiative effects observed in the quiescent stellar state compared to the CSD;
The asymmetrical disk’s temperature profile leads to differential snow line profiles for various species. Molecules can sublimate and freeze out along a single orbit, which can be observed due to the freeze-out timescales of less than 10 years under typical PPD conditions. These changes in the snow lines can significantly influence the chemical environment and material availability for planet formation, differing from those in single-star systems.
Our work represents a significant advancement in addressing various astrophysical problems by incorporating radiative transfer calculations alongside 3D hydrodynamical modeling for PPDs in stellar binaries. This implementation provides predictions of observable signposts that can be tracked over time in a CSD, enabling a deeper understanding of the interactions between physical and chemical processes in PPDs. Future monitoring of disks in binary systems, particularly those experiencing episodic accretion events, will be crucial. Such observations will help constrain not only the dynamical aspects of these complex systems but also yield insights into their chemical composition and structure. Understanding these factors will ultimately enhance our knowledge of planet formation processes, the environmental conditions that influence the development of planetary systems across binary stellar systems, and how they differ from single systems.
Data availability
The data underlying this article will be shared at a reasonable request by the corresponding author.
Acknowledgements
This project has received funding from the European Research Council (ERC) under the European Union Horizon Europe programme (grant agreement No. 101042275, project Stellar-MADE).
Appendix A Molecule freeze-out temperatures
The freeze-out temperature of a molecule is the temperature at which it transitions from a volatile state to ice, adhering to the surface of dust grains. Hollenbach et al. (2009) offers an approximation for calculating this temperature based on the freeze-out timescale and the thermal desorption rate. Firstly, the freeze-out timescale relates to the PPD conditions (Tielens & Allamandola 1987), including the abundance of dust grains relative to the total number of hydrogen nuclei (dgr), the number density of hydrogen (nH), gas temperature (Tgas), the atomic mass of a molecule (mi), and the dust grain size (s), expressed as:
![Mathematical equation: $\[\begin{aligned}& \tau_{\mathrm{fo}, i}=9.8[\mathrm{yr}] \times \\& \qquad\left(\frac{m_i}{m_{\mathrm{H}}}\right)^{0.5}\left(\frac{s}{0.1 ~\mu \mathrm{m}}\right)^{-2}\left(\frac{d_{\mathrm{gr}}}{10^{-14}}\right)^{-1}\left(\frac{n_{\mathrm{H}}}{10^{10} \mathrm{~cm}^{-3}}\right)^{-1}\left(\frac{T_{\mathrm{gas}}}{50 \mathrm{~K}}\right)^{-0.5}.\end{aligned}\]$](/articles/aa/full_html/2025/11/aa56014-25/aa56014-25-eq10.png) (A.1)
(A.1)
We have assumed a sticking probability of 1.
Finally, the thermal desorption rate relates to the vibrational frequency (νi) and the desorption energy (Ei), with values determined through laboratory experiments, alongside the temperature of the dust grains (Tdust), expressed as:
![Mathematical equation: $\[R_{\mathrm{td}, i} \simeq \nu_{\mathrm{i}} e^{-E_i / k_{\mathrm{B}} T_{\mathrm{dust}}},\]$](/articles/aa/full_html/2025/11/aa56014-25/aa56014-25-eq11.png) (A.2)
(A.2)
where kB is the Boltzmann’s constant. Note that the temperatures expressed in Equations A.1 and A.2 are not necessarily the same. We name as the freeze-out temperature (Tfo,i) as the temperature at which the condition Rtd,i(Tfo,i) = 1/τfo,i(Tfo,i) is satisfied. We solve the equation numerically, and Table A.1 shows the resulting freeze-out temperatures for five molecules. Note that Ferrero et al. (2020) reported that desorption energy values vary based on molecular structure and ice surface position, resulting in different freeze-out temperatures and consequently shifted snow line positions. Therefore, the values presented in Table A.1 are estimates of the freeze-out temperatures.
Adopted molecular vibrational frequency, desorption energy, atomic mass, and freeze-out temperature.
References
- Armitage, P. J. 2018, in Handbook of Exoplanets, ed. H. J. Deeg, & J. A. Belmonte, 135 [Google Scholar]
- Artur de la Villarmois, E., Jørgensen, J. K., Kristensen, L. E., et al. 2019, A&A, 626, A71 [NASA ADS] [CrossRef] [EDP Sciences] [Google Scholar]
- Artymowicz, P., & Lubow, S. H. 1994, ApJ, 421, 651 [Google Scholar]
- Audard, M., Ábrahám, P., Dunham, M. M., et al. 2014, in Protostars and Planets VI, eds. H. Beuther, R. S. Klessen, C. P. Dullemond, & T. Henning, 387 [Google Scholar]
- Ballabio, G., Dipierro, G., Veronesi, B., et al. 2018, MNRAS, 477, 2766 [NASA ADS] [CrossRef] [Google Scholar]
- Baraffe, I., Homeier, D., Allard, F., & Chabrier, G. 2015, A&A, 577, A42 [NASA ADS] [CrossRef] [EDP Sciences] [Google Scholar]
- Bate, M. R., Bonnell, I. A., & Price, N. M. 1995, MNRAS, 277, 362 [Google Scholar]
- Boitard-Crépeau, L., Ceccarelli, C., Beck, P., Vacher, L., & Ugliengo, P. 2025, ApJ, 987, L25 [Google Scholar]
- Bonnell, I., & Bastien, P. 1992, ApJ, 401, L31 [Google Scholar]
- Boogert, A. C. A., Gerakines, P. A., & Whittet, D. C. B. 2015, ARA&A, 53, 541 [Google Scholar]
- Booth, R. A., Clarke, C. J., Madhusudhan, N., & Ilee, J. D. 2017, MNRAS, 469, 3994 [Google Scholar]
- Borchert, E. M. A., Price, D. J., Pinte, C., & Cuello, N. 2022a, MNRAS, 510, L37 [Google Scholar]
- Borchert, E. M. A., Price, D. J., Pinte, C., & Cuello, N. 2022b, MNRAS, 517, 4436 [CrossRef] [Google Scholar]
- Boyajian, T. S., von Braun, K., van Belle, G., et al. 2012, ApJ, 757, 112 [Google Scholar]
- Brauer, F., Dullemond, C. P., & Henning, T. 2008, A&A, 480, 859 [NASA ADS] [CrossRef] [EDP Sciences] [Google Scholar]
- Ceccarelli, C., Codella, C., Balucani, N., et al. 2023, in Astronomical Society of the Pacific Conference Series, 534, Protostars and Planets VII, eds. S. Inutsuka, Y. Aikawa, T. Muto, K. Tomida, & M. Tamura, 379 [Google Scholar]
- Chiang, E. I., & Goldreich, P. 1997, ApJ, 490, 368 [Google Scholar]
- Cieza, L. A., Casassus, S., Tobin, J., et al. 2016, Nature, 535, 258 [Google Scholar]
- Cridland, A. J., van Dishoeck, E. F., Alessi, M., & Pudritz, R. E. 2020, A&A, 642, A229 [NASA ADS] [CrossRef] [EDP Sciences] [Google Scholar]
- Cuello, N., Alaguero, A., & Poblete, P. P. 2025, Symmetry, 17 [Google Scholar]
- Duchêne, G., & Kraus, A. 2013, ARA&A, 51, 269 [Google Scholar]
- Dunhill, A. C., Cuadra, J., & Dougados, C. 2015, MNRAS, 448, 3545 [NASA ADS] [CrossRef] [Google Scholar]
- Facchini, S., Lodato, G., & Price, D. J. 2013, MNRAS, 433, 2142 [Google Scholar]
- Ferrero, S., Zamirri, L., Ceccarelli, C., et al. 2020, ApJ, 904, 11 [NASA ADS] [CrossRef] [Google Scholar]
- Fischer, W. J., Hillenbrand, L. A., Herczeg, G. J., et al. 2023, in Astronomical Society of the Pacific Conference Series, 534, Protostars and Planets VII, eds. S. Inutsuka, Y. Aikawa, T. Muto, K. Tomida, & M. Tamura, 355 [Google Scholar]
- Franchini, A., Martin, R. G., & Lubow, S. H. 2019, MNRAS, 485, 315 [NASA ADS] [CrossRef] [Google Scholar]
- Fu, W., Lubow, S. H., & Martin, R. G. 2015, ApJ, 807, 75 [NASA ADS] [CrossRef] [Google Scholar]
- Gundlach, B., & Blum, J. 2015, ApJ, 798, 34 [Google Scholar]
- Hartmann, L., & Kenyon, S. J. 1996, ARA&A, 34, 207 [NASA ADS] [CrossRef] [Google Scholar]
- Herbst, E., & van Dishoeck, E. F. 2009, ARA&A, 47, 427 [NASA ADS] [CrossRef] [Google Scholar]
- Hirsh, K., Price, D. J., Gonzalez, J.-F., Ubeira-Gabellini, M. G., & Ragusa, E. 2020, MNRAS, 498, 2936 [NASA ADS] [CrossRef] [Google Scholar]
- Hollenbach, D., Kaufman, M. J., Bergin, E. A., & Melnick, G. J. 2009, ApJ, 690, 1497 [NASA ADS] [CrossRef] [Google Scholar]
- Hutchison, M., Price, D. J., & Laibe, G. 2018, MNRAS, 476, 2186 [Google Scholar]
- Kenyon, S. J., & Hartmann, L. 1987, ApJ, 323, 714 [Google Scholar]
- Kley, W., & Nelson, R. P. 2008, A&A, 486, 617 [NASA ADS] [CrossRef] [EDP Sciences] [Google Scholar]
- Kley, W., Papaloizou, J. C. B., & Ogilvie, G. I. 2008, A&A, 487, 671 [NASA ADS] [CrossRef] [EDP Sciences] [Google Scholar]
- Laibe, G., & Price, D. J. 2014a, MNRAS, 444, 1940 [Google Scholar]
- Laibe, G., & Price, D. J. 2014b, MNRAS, 440, 2147 [NASA ADS] [CrossRef] [Google Scholar]
- Larwood, J. D., Nelson, R. P., Papaloizou, J. C. B., & Terquem, C. 1996, MNRAS, 282, 597 [NASA ADS] [Google Scholar]
- Lee, J.-E., Lee, S., Baek, G., et al. 2019, Nat. Astron., 3, 314 [Google Scholar]
- Lee, J.-E., Evans, N. J., Baek, G., et al. 2025, ApJ, 978, L3 [Google Scholar]
- Lindblad, B. 1941, Stockholms Observ. Ann., 13, 10.1 [Google Scholar]
- Lodato, G., & Price, D. J. 2010, MNRAS, 405, 1212 [NASA ADS] [Google Scholar]
- Lucy, L. B. 1999, A&A, 345, 211 [NASA ADS] [Google Scholar]
- Madhusudhan, N. 2012, ApJ, 758, 36 [NASA ADS] [CrossRef] [Google Scholar]
- Madhusudhan, N. 2019, ARA&A, 57, 617 [NASA ADS] [CrossRef] [Google Scholar]
- Martin, R. G., Nixon, C., Lubow, S. H., et al. 2014, ApJ, 792, L33 [Google Scholar]
- Marzari, F., & D’Angelo, G. 2025, A&A, 695, A53 [NASA ADS] [CrossRef] [EDP Sciences] [Google Scholar]
- McClure, M. K., Rocha, W. R. M., Pontoppidan, K. M., et al. 2023, Nat. Astron., 7, 431 [NASA ADS] [CrossRef] [Google Scholar]
- Minissale, M., Aikawa, Y., Bergin, E., et al. 2022, ACS Earth Space Chem., 6, 597 [NASA ADS] [CrossRef] [Google Scholar]
- Miranda, R., & Lai, D. 2015, MNRAS, 452, 2396 [Google Scholar]
- Monin, J. L., Clarke, C. J., Prato, L., & McCabe, C. 2007, in Protostars and Planets V, eds. B. Reipurth, D. Jewitt, & K. Keil, 395 [Google Scholar]
- Muley, D., Melon Fuksman, J. D., & Klahr, H. 2024, A&A, 687, A213 [NASA ADS] [CrossRef] [EDP Sciences] [Google Scholar]
- Nealon, R., Price, D. J., & Pinte, C. 2020, MNRAS, 493, L143 [NASA ADS] [CrossRef] [Google Scholar]
- Nelson, A. F., & Marzari, F. 2016, ApJ, 827, 93 [Google Scholar]
- Nixon, C., King, A., & Price, D. 2013, MNRAS, 434, 1946 [NASA ADS] [CrossRef] [Google Scholar]
- Öberg, K. I., & Bergin, E. A. 2016, ApJ, 831, L19 [Google Scholar]
- Öberg, K. I., & Wordsworth, R. 2019, AJ, 158, 194 [Google Scholar]
- Öberg, K. I., & Bergin, E. A. 2021, Phys. Rep., 893, 1 [Google Scholar]
- Öberg, K. I., Murray-Clay, R., & Bergin, E. A. 2011, ApJ, 743, L16 [Google Scholar]
- Offner, S. S. R., Moe, M., Kratter, K. M., et al. 2023, in Astronomical Society of the Pacific Conference Series, 534, Protostars and Planets VII, eds. S. Inutsuka, Y. Aikawa, T. Muto, K. Tomida, & M. Tamura, 275 [Google Scholar]
- Okuzumi, S., & Tazaki, R. 2019, ApJ, 878, 132 [Google Scholar]
- Paardekooper, S., Dong, R., Duffell, P., et al. 2023, in Astronomical Society of the Pacific Conference Series, 534, Protostars and Planets VII, eds. S. Inutsuka, Y. Aikawa, T. Muto, K. Tomida, & M. Tamura, 685 [Google Scholar]
- Paczynski, B. 1977, ApJ, 216, 822 [CrossRef] [Google Scholar]
- Pichardo, B., Sparke, L. S., & Aguilar, L. A. 2005, MNRAS, 359, 521 [NASA ADS] [CrossRef] [Google Scholar]
- Pinte, C., Ménard, F., Duchêne, G., & Bastien, P. 2006, A&A, 459, 797 [NASA ADS] [CrossRef] [EDP Sciences] [Google Scholar]
- Pinte, C., Harries, T. J., Min, M., et al. 2009, A&A, 498, 967 [NASA ADS] [CrossRef] [EDP Sciences] [Google Scholar]
- Pinte, C., van der Plas, G., Ménard, F., et al. 2019, Nat. Astron., 3, 1109 [NASA ADS] [CrossRef] [Google Scholar]
- Poblete, P. P., Cuello, N., & Cuadra, J. 2019, MNRAS, 489, 2204 [NASA ADS] [CrossRef] [Google Scholar]
- Poblete, P. P., Calcino, J., Cuello, N., et al. 2020, MNRAS, 496, 2362 [NASA ADS] [CrossRef] [Google Scholar]
- Price, D. J., & Laibe, G. 2015, MNRAS, 451, 813 [NASA ADS] [CrossRef] [Google Scholar]
- Price, D. J., Wurster, J., Tricco, T. S., et al. 2018, PASA, 35, e031 [Google Scholar]
- Pringle, J. E. 1981, ARA&A, 19, 137 [NASA ADS] [CrossRef] [Google Scholar]
- Raghavan, D., McAlister, H. A., Henry, T. J., et al. 2010, ApJS, 190, 1 [Google Scholar]
- Ragusa, E., Dipierro, G., Lodato, G., Laibe, G., & Price, D. J. 2017, MNRAS, 464, 1449 [Google Scholar]
- Reipurth, B., Clarke, C. J., Boss, A. P., et al. 2014, in Protostars and Planets VI, eds. H. Beuther, R. S. Klessen, C. P. Dullemond, & T. Henning, 267 [Google Scholar]
- Ros, K., & Johansen, A. 2024, A&A, 686, A237 [NASA ADS] [CrossRef] [EDP Sciences] [Google Scholar]
- Rowther, S., Price, D. J., Pinte, C., et al. 2024, MNRAS, 534, 2277 [Google Scholar]
- Shakura, N. I., & Sunyaev, R. A. 1973, A&A, 24, 337 [NASA ADS] [Google Scholar]
- Tielens, A. G. G. M., & Allamandola, L. J. 1987, in Interstellar Processes, 134, eds. D. J. Hollenbach, & H. A. Thronson, Jr., 397 [Google Scholar]
- Tinacci, L., Germain, A., Pantaleone, S., et al. 2023, ApJ, 951, 32 [CrossRef] [Google Scholar]
- Tokovinin, A. 2014, AJ, 147, 87 [CrossRef] [Google Scholar]
- Tokovinin, A. 2021, Universe, 7, 352 [NASA ADS] [CrossRef] [Google Scholar]
- van’t Hoff, M. L. R., Harsono, D., Tobin, J. J., et al. 2020, ApJ, 901, 166 [Google Scholar]
- Vorobyov, E. I., & Basu, S. 2005, ApJ, 633, L137 [NASA ADS] [CrossRef] [Google Scholar]
- Vorobyov, E. I., Elbakyan, V. G., Liu, H. B., & Takami, M. 2021, A&A, 647, A44 [EDP Sciences] [Google Scholar]
- Zagaria, F., Rosotti, G. P., Alexander, R. D., & Clarke, C. J. 2023, Eur. Phys. J. Plus, 138, 25 [NASA ADS] [CrossRef] [Google Scholar]
- Zurlo, A., Weber, P., Pérez, S., et al. 2024, A&A, 686, A309 [NASA ADS] [CrossRef] [EDP Sciences] [Google Scholar]
All Tables
Adopted molecular vibrational frequency, desorption energy, atomic mass, and freeze-out temperature.
All Figures
|
Fig. 1 Flowchart illustrating the coupling between the SPH code Phantom and the radiative transfer code Mcfost. An ellipse represents the initial process, the main processes are shown in rectangles, and the decision node is depicted as a diamond. |
| In the text | |
|
Fig. 2 Temperature distributions of SPH particles (in the Phantom dumpfile) in the CSD are shown in the r′z plane for three heating scenarios: (top) vertically isothermal; (middle) irradiation from the primary star only; and (bottom) irradiation from both stars. These correspond to the Iso-Bin-q1, OS-Bin-q1, and Bin-q1 simulations, respectively. The left and right columns show the simulation’s initial and final states. A black star marks the primary star’s position, while a black arrow points to the secondary star. |
| In the text | |
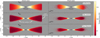 |
Fig. 3 Same as Fig. 2 but for a binary-disk orbital inclination of 30°. |
| In the text | |
|
Fig. 4 Median radial profile of disk density-weighted average temperatures (first row), aspect ratio (H/r, second row), surface density (Σ, third row), and the normalized surface density cumulative integral (Σ CI, fourth row) for a coplanar (left) and inclined by 30° (right). Each panel compares simulations with a vertically isothermal temperature profile (Iso-Bin-q1 in green), a one-star heating model (OS-Bin-q1 in blue), and a two-star heating model (Bin-q1 in magenta). Solid lines represent the median values along one binary orbit (between the ninth and tenth), while the shaded colored regions illustrate the median absolute deviation. The shaded gray areas denote the primary star’s accretion radius. The black arrow indicates the location of the companion star. The dotted line in the second, third, and fourth rows depicts the initial values for the H/r, surface density profiles, and the normalized surface density cumulative integral, respectively. |
| In the text | |
|
Fig. 5 Column density maps of circumstellar disks in coplanar (left) and inclined (right) binary systems at the apocenter (top) and pericenter (bottom), viewed face-on with respect to the circumprimary disk in Bin-q1. The evolutionary time at the pericenter and apocenter corresponds to 9.5 and 10 binary orbits, respectively. Contours depict approximate density-weighted average temperatures along the line of sight for the H2O (white), NH3 (cyan), and CO2 (black) snow lines at 130 K, 80 K, and 50 K, respectively. The green area represents temperatures below 30 K, visible only in the lower-left panel for these configurations, which traces the CO and N2 snowlines. |
| In the text | |
|
Fig. 6 Density-weighted average temperature difference between the near and far sides of the disk in the Bin-q1 simulation shown as a function of radius for both the coplanar (blue) and inclined (magenta) configurations. The solid lines indicate the apocenter position of the binary orbit, while the dash-dotted lines correspond to the pericenter. |
| In the text | |
|
Fig. 7 Disk aspect ratio profiles and relative variations from NT-Bin-q1 (blue) and Dust-Bin-q1 (magenta) simulations for the Bin-q1 case. The bottom panels quantify the relative difference in aspect ratio, Δ(H/r), between these two simulations, normalized to the aspect ratio from the dust-free simulation, (H/r)0. |
| In the text | |
|
Fig. 8 Column density maps of circumstellar disks for Bin-q05 and FU-Bin-q05, labeled similarly to Figure 5. The green area represents temperatures below 30 K. The upper and middle rows illustrate the disk morphology of Bin-q05 at apocenter and pericenter, respectively. The bottom row depicts the same evolutionary time shown in the middle row, but for the outbursting companion star: FU-Bin-q05. The secondary star is not depicted for easy visualization of its circumstellar disk. |
| In the text | |
|
Fig. 9 Figure compares the disk aspect ratio profile for Bin-q05 (blue) and FU-Bin-q05 (magenta). The bottom panels quantify the relative differences between these two quantities across the two simulations, normalized to the values obtained from Bin-q 05. |
| In the text | |
|
Fig. 10 Temperature evolution for the inclined Bin-q1 simulation, along the two final binary orbits for three SPH particles, which represent different mean radial distances: 3.4 au (green), 5.8 au (blue), and 7.3 au (magenta). The vertical gray areas highlight the pericenter phase of the binary system, while the horizontal dashed lines indicate two specific temperature values. |
| In the text | |
Current usage metrics show cumulative count of Article Views (full-text article views including HTML views, PDF and ePub downloads, according to the available data) and Abstracts Views on Vision4Press platform.
Data correspond to usage on the plateform after 2015. The current usage metrics is available 48-96 hours after online publication and is updated daily on week days.
Initial download of the metrics may take a while.