Open Access
Fig. A.2
Download original image
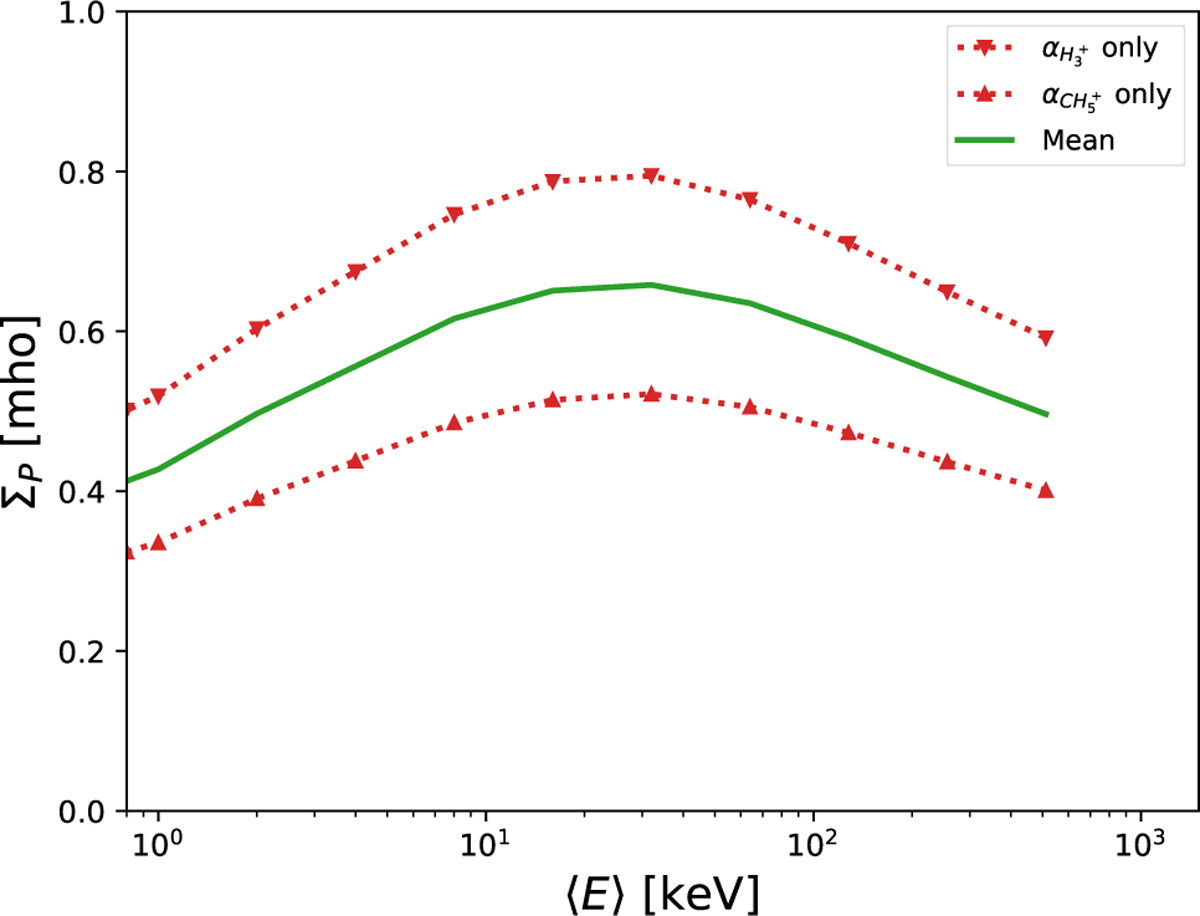
Pedersen conductance computed using a kappa electron energy distribution. The upper (lower) red curve represents the conductance when using the value of ![]() (
(![]() ). The green curve represents the mean conductance deduced from the corresponding values on the red curves.
). The green curve represents the mean conductance deduced from the corresponding values on the red curves.
Current usage metrics show cumulative count of Article Views (full-text article views including HTML views, PDF and ePub downloads, according to the available data) and Abstracts Views on Vision4Press platform.
Data correspond to usage on the plateform after 2015. The current usage metrics is available 48-96 hours after online publication and is updated daily on week days.
Initial download of the metrics may take a while.