Fig. D.1
Download original image
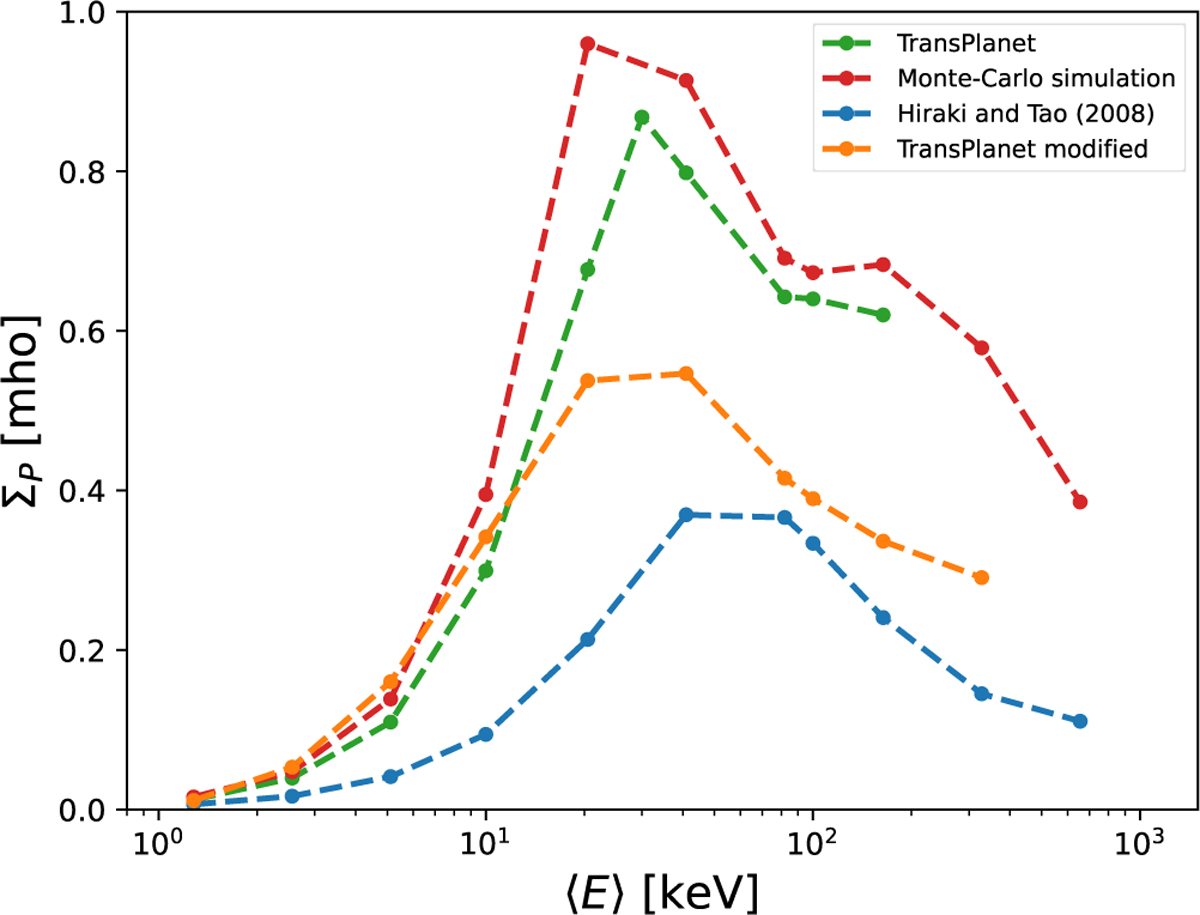
Evolution of the mono-energetic Pedersen conductance computed with TransPlanet (green and orange curves), a Monte Carlo simulation (red curve) and the analytical expression from Hiraki & Tao (2008) (blue curve) giving the ion production rate. The green and red curves are computed with the same ionization cross sections of H2, which are the cross sections used in this study, and the blue and orange curves are computed with the ionization cross sections from Hiraki & Tao (2008).
Current usage metrics show cumulative count of Article Views (full-text article views including HTML views, PDF and ePub downloads, according to the available data) and Abstracts Views on Vision4Press platform.
Data correspond to usage on the plateform after 2015. The current usage metrics is available 48-96 hours after online publication and is updated daily on week days.
Initial download of the metrics may take a while.