Fig. E.1
Download original image
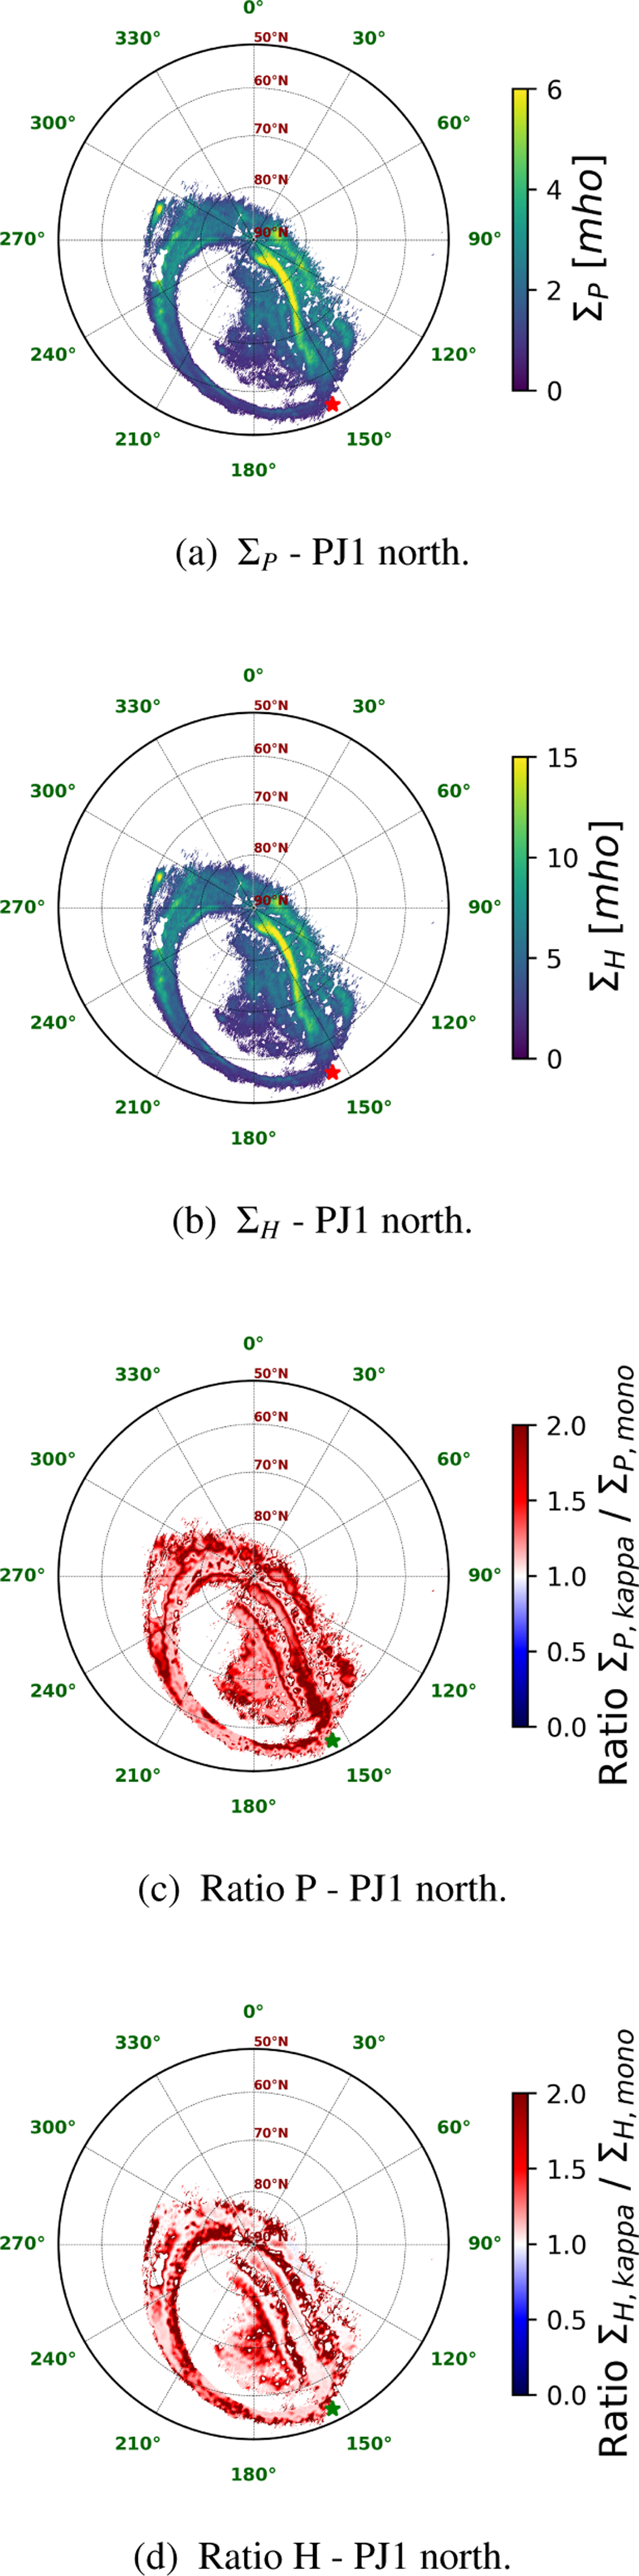
Conductance maps of the northern auroral region during PJ1. (a) and (b) represent the kappa Pedersen and Hall conductance maps, respectively. The ratios of the conductance map computed with a kappa electron energy distribution over the conductance map computed with a mono-energetic electron energy distribution are also represented for the (c) Pedersen and (d) Hall conductances. For the ratio maps, the scale goes up to 2 but the ratio can be locally higher. On each map, the red or green star represents the subsolar longitude.
Current usage metrics show cumulative count of Article Views (full-text article views including HTML views, PDF and ePub downloads, according to the available data) and Abstracts Views on Vision4Press platform.
Data correspond to usage on the plateform after 2015. The current usage metrics is available 48-96 hours after online publication and is updated daily on week days.
Initial download of the metrics may take a while.