Fig. 2
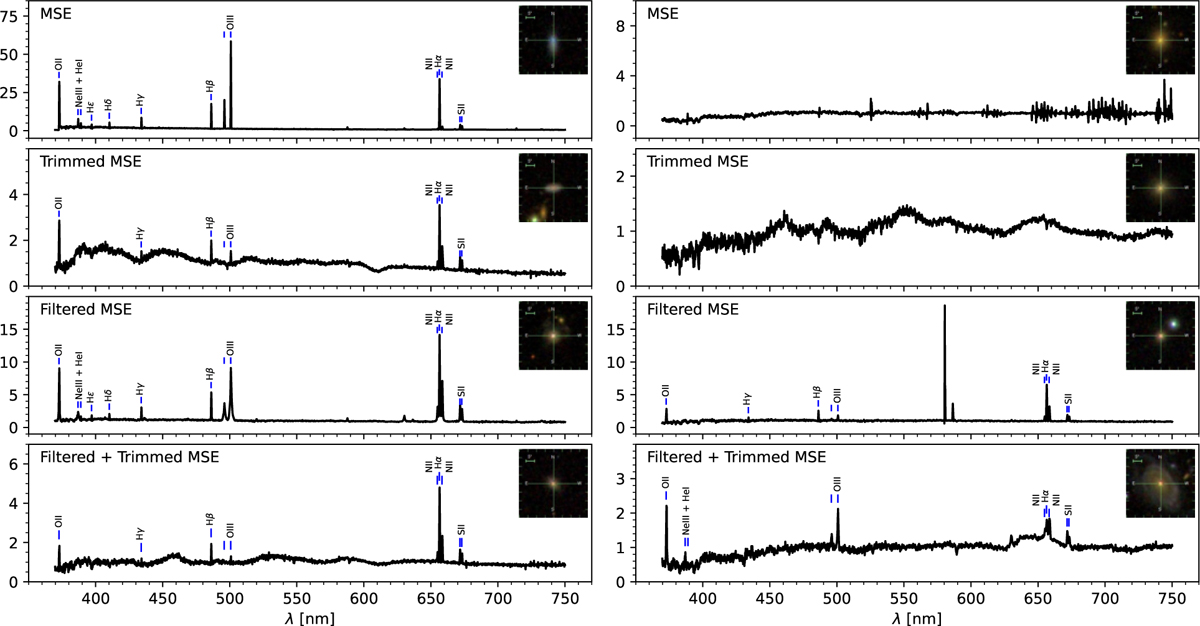
Download original image
Overview of SDSS anomalies identified by different variations of the MSE score. Each row displays example spectra (with SDSS imaging thumbnails) that we found using the respective MSE variation (e.g., MSE or trimmed MSE), with two representative examples per variation. The different MSE variations effectively highlight different anomalous patterns in the spectra. The fluxes are median normalized.
Current usage metrics show cumulative count of Article Views (full-text article views including HTML views, PDF and ePub downloads, according to the available data) and Abstracts Views on Vision4Press platform.
Data correspond to usage on the plateform after 2015. The current usage metrics is available 48-96 hours after online publication and is updated daily on week days.
Initial download of the metrics may take a while.