Fig. 3
Download original image
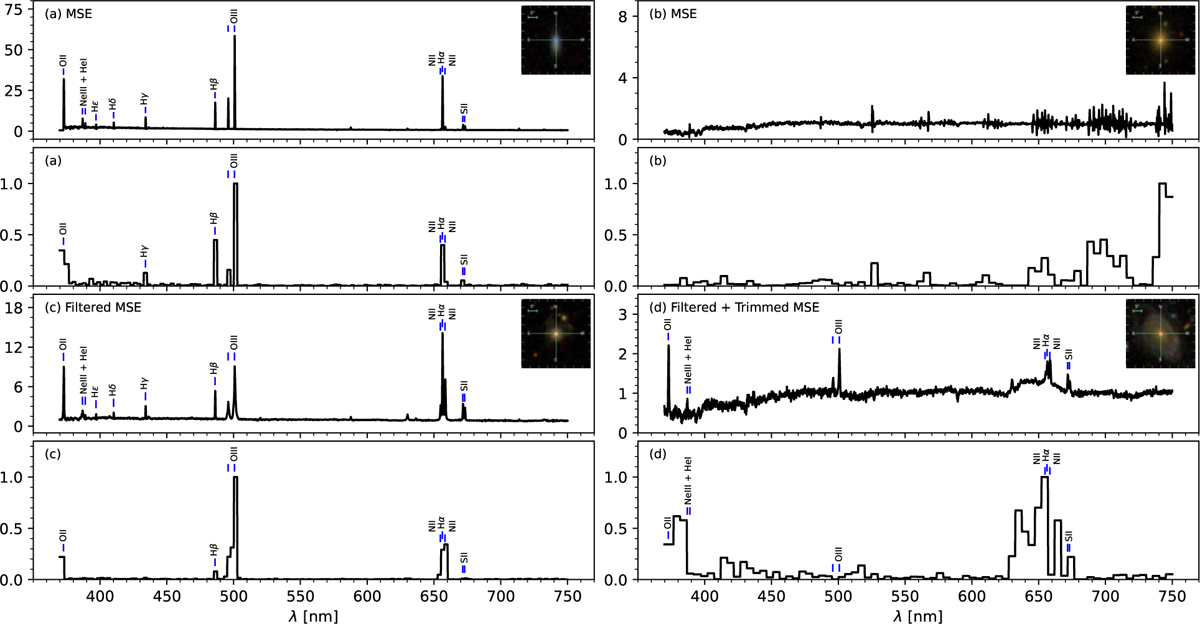
Explanations of four representative anomalies detected with different MSE-based scores, each showing the median normalized flux (top. with an SDSS imaging thumbnail) and corresponding maximum normalized LIME explanation weights (bottom). The panels show: (a) an extreme emission-line object driven by [OIII] and Hα peaks (MSE), (b) the red-end weighting from likely instrumental noise (MSE), (c) a broad emitter with high weights on Hα and [OII] (filtered MSE), and (d) continuum deviations near Hα and the 400 nm break (filtered + trimmed MSE). The explanations consistently highlight features driving the anomaly. This agrees with astronomers’ interpretations.
Current usage metrics show cumulative count of Article Views (full-text article views including HTML views, PDF and ePub downloads, according to the available data) and Abstracts Views on Vision4Press platform.
Data correspond to usage on the plateform after 2015. The current usage metrics is available 48-96 hours after online publication and is updated daily on week days.
Initial download of the metrics may take a while.