Fig. 4
Download original image
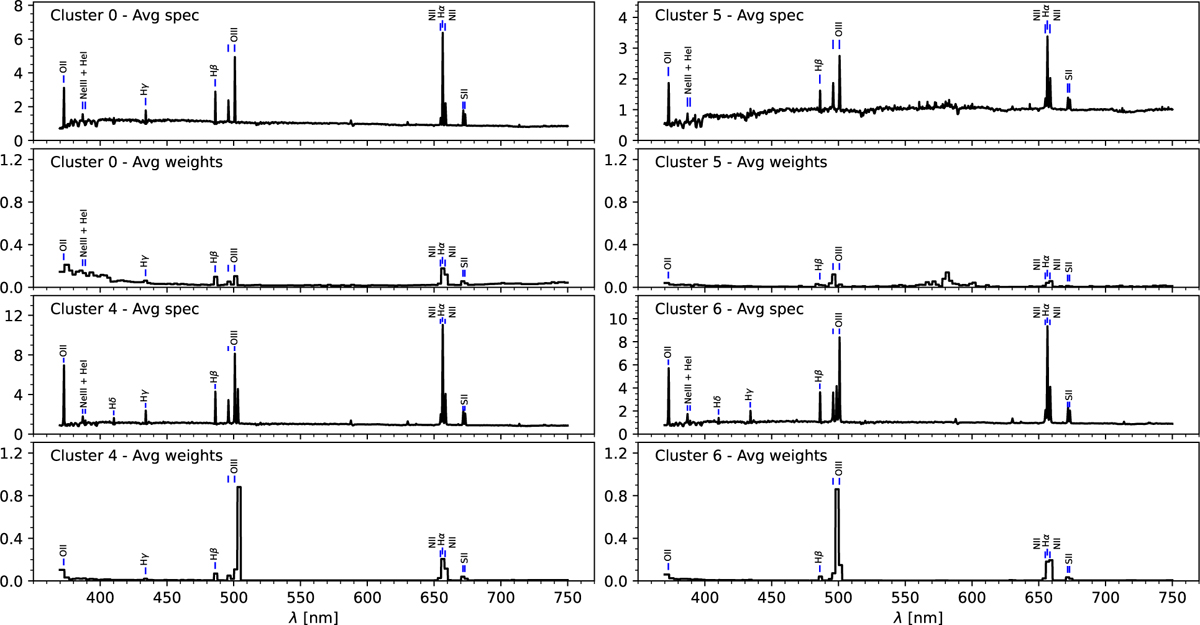
Average spectrum and LIME explanation weights for clusters 0, 5, 4, and 6 from the top 1% most anomalous spectra (MSE score). Clusters 0 and 5 (top rows) show diffuse or noisy explanations with low weights, which is consistent with poor continuum reconstructions or spikes. Clusters 4 and 6 (bottom rows) feature strong weights at truncated [OIII] λ500.7 lines due to masked regions during preprocessing. This illustrates how explanation-based clustering isolates artifacts from astrophysical signals. The fluxes are median normalized.
Current usage metrics show cumulative count of Article Views (full-text article views including HTML views, PDF and ePub downloads, according to the available data) and Abstracts Views on Vision4Press platform.
Data correspond to usage on the plateform after 2015. The current usage metrics is available 48-96 hours after online publication and is updated daily on week days.
Initial download of the metrics may take a while.