| Issue |
A&A
Volume 703, November 2025
|
|
|---|---|---|
| Article Number | A165 | |
| Number of page(s) | 14 | |
| Section | Extragalactic astronomy | |
| DOI | https://doi.org/10.1051/0004-6361/202556776 | |
| Published online | 21 November 2025 | |
Off-centre black hole seed formation: Implications for high- and low-redshift massive black holes
1
Dipartimento di Fisica “G. Occhialini”, Università degli Studi di Milano-Bicocca, Piazza della Scienza 3, I-20126 Milano, Italy
2
INFN, Sezione di Milano-Bicocca, Piazza della Scienza 3, 20126 Milano, Italy
3
Como Lake Center for AstroPhysics, University of Insubria, 22100 Como, Italy
4
Institut d’Astrophysique de Paris, Sorbonne Université, CNRS, UMR 7095, 98 bis bd Arago, 75014 Paris, France
5
Osservatorio Astronomico di Cagliari, via della Scienza 5, 09047 Selargius (CA), Italy
6
Donostia International Physics Centre (DIPC), Paseo Manuel de Lardizabal 4, 20018 Donostia-San Sebastian, Spain
7
IKERBASQUE, Basque Foundation for Science, E-48013 Bilbao, Spain
⋆ Corresponding author: This email address is being protected from spambots. You need JavaScript enabled to view it.
Received:
7
August
2025
Accepted:
17
September
2025
Abstract
Recent studies show that light seeds of black holes, which grow into massive black holes (MBHs) over time, often struggle to remain at the centres of their birthplaces in high-redshift galaxies, limiting their ability to accrete gas and merge with other black holes. In this work, we investigate how off-centre formation of the first seeds affects the evolution of the MBH and massive black hole binary (MBHB) populations over cosmic history. To this end, we used the L-GalaxiesBH semi-analytical model, which includes multiple seed formation mechanisms, with light Population III remnants being the most significant contributors. To incorporate off-centre formation, we modified the model to track the initial seed location, the sinking timescales towards the galactic centre, and any growth during this phase. Our results indicate that seed formation occurring away from the galactic centre has a negligible impact on the MBH population at z < 1, but causes significant differences at higher redshifts. In particular, the abundance of > 105 M⊙ MBHs at z > 4 can be 2–10 times smaller than in a nuclear seed formation model. Quasar luminosity functions with Lbol > 1044 erg/s are similarly affected, although they continue to align with observational constraints. Off-centre formation also alters the galaxy-MBH mass relation. At z > 5, the amplitude of the relation can be up to 2 dex smaller than in nuclear seed models. These differences fade by z ∼ 2 for galaxies > 1011 M⊙, and by z = 0 for less massive galaxies. Notably, the overmassive MBH population recently unveiled by JWST is still present in the model, suggesting that these objects can form independently of the seed dynamics. Finally, the merging rate of MBHs within the LISA sensitivity band is strongly impacted. Specifically, there is a suppression of events at high-z and an enhancement at low-z.
Key words: gravitational waves / galaxies: high-redshift / galaxies: nuclei / quasars: supermassive black holes / galaxies: star clusters: individual
© The Authors 2025
 Open Access article, published by EDP Sciences, under the terms of the Creative Commons Attribution License (https://creativecommons.org/licenses/by/4.0), which permits unrestricted use, distribution, and reproduction in any medium, provided the original work is properly cited.
This article is published in open access under the Subscribe to Open model. This email address is being protected from spambots. You need JavaScript enabled to view it. to support open access publication.
1. Introduction
Our understanding of massive black holes (MBHs) has greatly advanced since the discovery of the first quasar (Schmidt 1963). Observations in the nearby Universe have confirmed the presence of MBHs at the centres of most massive galaxies. Furthermore, these studies have underscored the importance of gas accretion in powering quasars and have revealed the connection between MBH masses and the properties of their host galaxies (Soltan 1982; Haehnelt & Rees 1993; Häring & Rix 2004; Marconi et al. 2004; Kormendy & Ho 2013; Savorgnan et al. 2016). These investigations have been extended to higher redshifts thanks to the discovery of hyper-luminous quasars (> 1047 erg/s with > 108 M⊙ at z > 7; Wu et al. 2015; Bañados et al. 2018; Yang et al. 2020) and the large population of candidate Active Galactic Nuclei (AGNs, 1044 − 46 erg/s with > 106 M⊙ at z > 4) recently unveiled by the James Webb Space Telescope (JWST; Maiolino et al. 2024; Matthee et al. 2024; Harikane et al. 2023; Kokorev et al. 2024; Geris et al. 2025). Determining the abundance and properties of MBHs in the early Universe is essential for uncovering their origins. A census of the masses and luminosities of high-z quasars is crucial for constraining the processes behind MBH formation, commonly referred to as MBH seeding (see Volonteri 2010; Inayoshi et al. 2020). The formation of the first MBHs remains uncertain, with several competing hypotheses under investigation. One leading scenario involves the formation of light MBH seeds (∼100 M⊙). These seeds are thought to be remnants of Population III (PopIII) stars formed in haloes of 106 M⊙ at z > 15 (Madau & Rees 2001; Schneider et al. 2002, 2006; Schaerer 2002; Bromm & Larson 2004; Latif & Schleicher 2015a; Haemmerlé et al. 2018). Recent studies suggest that these light seeds can evolve into the bright, rare AGNs observed at z > 6, as long as they undergo episodes of super-Eddington accretion (Pezzulli et al. 2017), or if they form as early as z > 35 and grow at a constant Eddington rate during ∼60% of their lifetime (Madau & Rees 2001; Tanaka & Haiman 2009). Other scenarios suggest that intermediate-mass (∼103 M⊙) and heavy (∼ 105−6 M⊙) MBH seeds may have formed at z > 7 through stellar (black hole) runaway collisions in dense star clusters, or through the direct collapse of gas clouds under particular conditions that prevent gas cooling and fragmentation (Ebisuzaki et al. 2001; Begelman et al. 2006; Lodato & Natarajan 2006; Devecchi & Volonteri 2009; Devecchi et al. 2012; Regan et al. 2014; Lupi et al. 2014; Latif & Schleicher 2015b; Valiante et al. 2017; Reinoso et al. 2018; Chon & Omukai 2020; Sassano et al. 2021; Rantala et al. 2024). Although these alternative scenarios relax the need for super-Eddington or nearly continuous Eddington-limited accretion (see also Lupi et al. 2024), assembling a population of > 106 M⊙ at 6 < z < 20 requires specific conditions to be met, and a certain level of sustained mass accretion remains necessary.
Despite the various MBH seeding hypotheses, gas accretion on MBH seeds remains a fundamental process for explaining the existence of > 106 M⊙ MBHs at z > 6. How seeds sustain their growth remains uncertain and controversial. Using hydrodynamical simulations, Mehta et al. (2024) showed that in the absence of supernova feedback, light seeds can remain at the centre of their natal gas clumps and grow efficiently in just a few Myr. Shi et al. (2024) report complementary results, indicating that while feedback processes hinder their growth, light seeds can still experience short phases of very high accretion rates. Conversely, other studies focusing on MBH dynamics have questioned whether light seeds can sustain significant growth phases. For instance, using high-resolution simulations, Smith et al. (2018) tracked the growth of thousands of light seeds (≲100 M⊙) formed within mini-haloes in the early Universe. Their findings showed that these MBHs are scattered throughout their host galaxies, preventing them from residing in the nuclear clumps of cool, dense gas. As a result, light seeds rarely undergo significant periods of growth, limiting the formation of an intermediate population of MBHs in the early Universe. Simulations by Pfister et al. (2019) on the dynamics of high-z seeds showed that light MBH seeds (< 105 M⊙) are prone to starvation, as they are more easily scattered within their host galaxy due to irregularities in the gas and stellar potential, and remain far from dense gas regions, which limited their growth (see Bellovary et al. 2019 for comparable findings in low-z dwarf galaxies). The difficulties experienced by light MBH seeds in their migration towards galactic centres were also confirmed by the simulations of Ma et al. (2021), who show that the chaotic, rapidly evolving, clumpy, and bursty nature of high-redshift galaxies hinders the ability of low-mass seeds to sink efficiently from the outskirts to the central regions. Several studies have also shown that MBH seeds can overcome these difficulties and stabilise at the galactic centre, experiencing significant growth, as long as they form within and co-evolve with nuclear star clusters (NSCs). Specifically, the mass of these NSCs is typically sufficient to resist external perturbations and to facilitate the efficient migration of the seed towards the galactic centre (see e.g. Alexander & Natarajan 2014; Biernacki et al. 2017).
The studies discussed above suggest that off-centre formation of light seeds, followed by a wandering phase before potentially settling in the galactic nucleus, represents a likely evolutionary pathway. However, to date, no systematic study has investigated how this process influences the evolution of the MBH and MBHB populations across different cosmological epochs. In this study, we aim to advance this line of research by applying the L-GalaxiesBH semi-analytical model (SAM) to merger trees from the Millennium simulation suite (Henriques et al. 2015). The paper is organised as follows. Section 2 describes the main characteristics of the L-GalaxiesBH SAM and the merger trees from the Millennium simulation suite. In Section 3, we introduce the model included within the SAM to address the off-centre formation and wandering phase of the first-forming MBH seeds. In Section 4, we present how the off-centre seed formation and its wandering phase affect the global population of MBHs. Section 5 discusses the main effects on the MBHB population. Finally, in Section 6, we summarise the key findings. A Lambda Cold Dark Matter (ΛCDM) cosmology with parameters Ωm = 0.315, ΩΛ = 0.685, Ωb = 0.045, σ8 = 0.9, and H0 = 67.3 km s−1 Mpc−1 is adopted throughout the paper (Planck Collaboration XVI 2014).
2. L-GalaxiesBH semi-analytical model
In this section, we present the L-GalaxiesBH SAM (Bonoli et al. 2025). In brief, L-GalaxiesBH is based on the L-Galaxies SAM presented in Henriques et al. (2015), which is designed to track the cosmological assembly of galaxies through a set of analytical equations solved along the merger trees of dark matter (DM) haloes. The most recent updates to the L-Galaxies model, introduced in Izquierdo-Villalba et al. (2020, 2022), and Spinoso et al. (2023), have led to the development of the L-GalaxiesBH version. This extended framework allows for detailed tracking of the formation and evolution of both single and binary MBHs.
2.1. Dark matter merger trees: N-body simulations
Like L-Galaxies, L-GalaxiesBH is designed to run on top of different DM merger trees extracted from N-body DM-only simulations. In particular, it has been extensively tested in the Millennium and TNG-DARK suites of simulations (see Henriques et al. 2015; Ayromlou et al. 2021). We employed the merger trees extracted from the Millennium (MS, Springel 2005) and Millennium-II (MSII, Boylan-Kolchin et al. 2009) simulations. The MS follows the evolution of 21603 DM particles of mass 8.6 × 10⁸ M⊙/h inside a periodic box of 500 Mpc/h on a side, from z = 127 to the present. The MSII tracks the same number of particles but with a mass resolution 125 times higher (6.885 × 10⁶ M⊙/h), in a box 125 times smaller (100 Mpc/h). Snapshots of MS and MSII were stored at 63 and 68 epochs, with a time separation of ∼300 Myr. We identified the structures formed in these simulations by applying the friend-of-friends and SUBFIND algorithms and arranged them into merger trees using the L-HALOTREE code (Springel et al. 2001). Finally, the two simulations were rescaled using the procedure of Angulo & White (2010) to match the cosmological parameters provided by Planck Collaboration XVI (2014).
2.2. The grafting procedure: Extending the resolution of the underlying DM merger trees
One of the main limitations of SAMs concerns the minimum halo mass of the merger trees used, i.e. the mass resolution. In particular, this limitation results in an incomplete simulated galaxy merger history derived from the underlying DM evolution and sets a clear lower limit on the galaxy and MBH evolutionary pathways that can be traced. Although these drawbacks are well known, they are unavoidable given the current difficulties in simulating large cosmological volumes at high resolution. To mitigate these flaws, in this work we used the so-called grafting methodology, a two-step process presented in Angulo et al. (2014) and Bonoli et al. (in prep.). In the first step, one extends the branches of the targeted merger trees below their massresolution limit using the input of higher-resolution merger trees. This enables the reconstruction of a realistic number of mergers that would otherwise be missed because of mass resolution limits. The second step aims to recover the evolution of structures that are not directly resolved, so that newly initialised galaxies are modelled as evolved systems rather than just pristine reservoirs of baryonic matter. To do so, each newly resolved halo of the targeted merger tree is initialised with a random galaxy (hosted at the same redshift and halo-mass bin) extracted from a run of L-GalaxiesBH on merger trees with higher resolution. Following Bonoli et al. (in prep.), we applied the grafting methodology when running L-GalaxiesBH on the MS merger trees, using the MSII to supply the higher resolution information (see Bonoli et al. in prep., for more details). This procedure enabled us to use the results of the MS to sample large volumes (which is crucial for exploring the high-z Universe), while exploiting merger trees that are as complete as those of the MSII. We also used the MSII to explore the off-centre formation and subsequent wandering phase of MBH seeds. However, we did not further extend its merger trees due to the absence of higher-resolution merger-tree data.
2.3. From gas to stars: The formation of galaxies
The galaxy formation model included in L-GalaxiesBH is based on the formalism developed by White & Rees (1978) and White & Frenk (1991). When a DM halo collapses, a fraction of baryons is captured within it, forming a hot gaseous atmosphere. Over time, this gas cools radiatively and settles at the centre of the halo, forming a disc-like structure due to the conservation of angular momentum. The continuous inflow of cold gas triggers star formation (SF), leading to the formation of a stellar disc structure and triggering supernova (SN) explosions following the death of massive, short-lived stars. This process regulates the assembly of galaxies via the heating and ejection of the galaxy’s cold gas component. The continuous gas accretion of the galaxy’s central MBH from the hot gas atmosphere also regulates gas cooling by injecting energy into the intracluster medium. The galaxy can develop a central ellipsoidal component via disc instabilities (secular evolution) or through galaxy mergers. This process occurs after the merger of the two parent haloes, on a timescale given by Binney & Tremaine (2008). Major mergers involve two similar galaxies and lead to the formation of a spheroidal galaxy. Conversely, minor mergers involve galaxies with very different masses and allow the survival of the most massive galaxy disc component, as well as the growth of its bulge due to the integration of the entire stellar mass of the satellite galaxy. Environmental processes such as ram pressure stripping or galaxy tidal disruption are also included in the model and play a key role in shaping the galaxy population (see Henriques et al. 2015, 2020, for further details). Finally, we note that, to improve the coarse time resolution of the MS and MSII outputs, L-GalaxiesBH performs an internal time interpolation (∼5 − 20 Myr) between snapshots.
2.4. Massive black holes
Here, we briefly describe the physical prescriptions implemented in L-GalaxiesBH to model the formation and growth of MBHs, as well as the dynamical evolution of MBHBs.
2.4.1. Multiple-channel formation of the first MBHs
The seeding scenario implemented in L-GalaxiesBH is presented in Spinoso et al. (in prep.) and extends the model described in Spinoso et al. (2023), which accounts for a multi-channel formation of MBH-seeds. Specifically, the model includes the simultaneous formation of four different categories of MBH seeds: PopIII remnants, runaway stellar mergers (RSM) seeds, direct collapse black hole seeds (DCBHs), and merger-induced direct collapse seeds (miDCBH). To provide a physical basis for the DCBH and RSM seeding scenario, Spinoso et al. (2023) modelled the diffusion and propagation of metals and Lyman-Werner (LW) photons following SF and the associated SN events. To this end, the authors account for both the presence of uniform radiation backgrounds and local variations in the intergalactic medium (IGM) chemical enrichment and LW illumination. These spatial variations were produced around galaxies by intense SF events, which acted both as luminous LW sources and as drivers for the ejection of strong metallic winds powered by recent SN explosions. We note that this MBH seeding model is only applied to the MSII merger trees, whose DM mass resolution makes it possible to track the physical processes occurring in atomic cooling haloes (Mhalo > 107 M⊙ at z > 7), where the seeding of RSMs and DCBHs is thought to occur (Inayoshi et al. 2020). The main differences between the models presented in Spinoso et al. (in prep.) and in Spinoso et al. (2023) concern the different treatment of PopIII remnants. In the following, we briefly describe the seeding channels that coexist in the current version of L-GalaxiesBH.
– PopIII remnant seeds: Although the MSII can resolve haloes of ∼108 M⊙, its mass resolution limits the ability to trace the evolution of the so-called mini-haloes (Mhalo ∼ 106 M⊙ at z > 10), where the formation of < 103 M⊙ MBH seeds is thought to take place (Bromm 2013). To overcome this shortcoming, we followed the sub-grid phenomenological model proposed by Spinoso et al. (in prep.), according to which the properties of PopIII remnant seeds are determined from the gas mass available in DM haloes as soon as they are newly resolved in the DM simulation at redshift zR. Thus, every time a halo was newly resolved in the merger tree, it was assigned a probability of being seeded with a light seed according to (Spinoso et al. 2023; Izquierdo-Villalba et al. 2023):
![Mathematical equation: $$ \begin{aligned} \mathcal{P} \,{=}\, \min \left[1,\, \mathcal{A} (1+ z_R )^{\gamma } \left( \frac{\mathrm{M_{halo}}}{\mathrm{\, M_{halo}^{th}}}\right)\right], \end{aligned} $$](/articles/aa/full_html/2025/11/aa56776-25/aa56776-25-eq1.gif) (1)
(1)
where 𝒜 = 0.02, γ = 7/2, and  are free parameters chosen so that the MBH occupation fraction is similar to that presented in Spinoso et al. (2023), taking into account the PopIII population derived from the GQd Press-Schechter SAM (Valiante et al. 2021). We set 𝒫 to 1 for all Mhalo values that would provide 𝒫 > 1. The end of the PopIII seeding era is set by fixing the values of 𝒫 to 0 once the average IGM metallicity in the MSII volume exceeds the critical metallicity threshold Zcrit = 10−3.5 Z⊙, which corresponds to z ∼ 7 (see Fig. 1 in Spinoso et al. 2023). Once 𝒫 was assigned to a halo, we drew a random value ℛ ∈ [0 − 1], such that if ℛ > 𝒫, a remnant PopIII MBH was seeded. The mass, MBH(zR), is determined as
![Mathematical equation: $$ \begin{aligned} \mathrm M_{BH}( z_\mathrm R)\,{=}\,M_{BH}( z_f\mathrm )\,\cdot \,exp\left[\, f_{\mathrm {Edd}}^{\,\mathrm {Unres}} \frac{1-\eta ( t)}{\epsilon ( t )}\frac{\delta t}{ t_{\mathrm {Edd}}} \right], \end{aligned} $$](/articles/aa/full_html/2025/11/aa56776-25/aa56776-25-eq3.gif) (2)
(2)
where MBH(zf) corresponds to the mass of the MBH at the formation redshift, zf. The latter was randomly chosen between zR and z = 35, corresponding to the maximum redshift expected for the formation of PopIII stars (Bromm 2013). As mentioned above, we used the gas content of the newly resolved DM halo at zR to estimate the properties of the PopIII remnant seeds at zf. In particular, we obtained  , the stellar mass formed during the unresolved evolution of the DM halo. As in Spinoso et al. (in prep.),
  was derived from an SF prescription adapted from Eq. S14 of Henriques et al. (2015), which links the production of
  to the cold fraction of the DM haloes’ gas content. Although we calculated it at zR, we further assumed that
  formed at zf in a single, initial SF episode and did not evolve down to zR. This enabled us to derive MBH(zf) by randomly sampling a Larson initial mass function (IMF, see Larson 1998) until
  was reached. The actual MBH(zf) was set to the maximum sampled mass, after considering appropriate1 mass-intervals when randomly sampling the Larson IMF. The second term in Eq. (2) captures the unresolved growth during the time δt elapsed between zf and zR. The variable η (ϵ) is the accretion (radiative) efficiency, tEdd = 0.45 Gyr, and
  , defined as the ratio between the bolometric (Lbol) and the Eddington luminosity (LEdd). This means that
  can be used to parametrise the unknown growth regime of PopIII seeds during their unresolved evolution. In this paper, for simplicity, we assume
  with a fixed spin value, a, randomly selected between [0,1)2. We stress that the unresolved growth of PopIII remnant seeds will be modified when off-centre seed formation is included (see Section 3).
– RSM seeds: The formation of intermediate-mass seeds via the collapse of dense, nuclear stellar clusters is also accounted for in the SAM. To this end, Spinoso et al. (2023) adapted the analytical prescription of Devecchi & Volonteri (2009) to L-GalaxiesBH assuming that newly resolved haloes exposed to moderate local LW flux (> 1 J21, where  ) and subject to mild chemical enrichment (< 10−3 Z⊙) can effectively host their first episodes of SF within their very dense central regions. This can subsequently produce a compact and massive (∼ 104−6 M⊙) nuclear stellar cluster (NSC), which further collapses into a single, massive object of Mseed ∼ 103−4 M⊙ via runaway stellar mergers. This process is modelled following Devecchi & Volonteri (2009) and relies on DM halo properties, such as halo spin and virial mass, as input parameters (see Spinoso et al. 2023).
– DCBH seeds: The model assumes that massive seeds of 105 M⊙ can form in haloes that (i) never experienced an SF event, (ii) are illuminated by a high local LW flux (> 10 J21) that can hinder any unresolved H2-cooling, gas fragmentation, and SF events (Abel et al. 2000; Yoshida et al. 2003; Shang et al. 2010; Visbal et al. 2014; Luo et al. 2020), and (iii) contain enough chemically pristine gas (< 10−4 Z⊙). We refer to Spinoso et al. (2023) for further details on the DCBH formation model and justification of the local LW flux threshold.
– miDCBHs seeds: The formation of massive DCBHs can also be triggered during major mergers of high-z galaxies (Mayer & Bonoli 2019). L-GalaxiesBH models this formation channel following Bonoli et al. (2014), who assume that miDCBHs are formed if (i) the merger baryonic mass ratio is > 0.3, (ii) the merger remnant has a halo mass > 109 M⊙, (iii) the total cold gas mass carried by the two interacting galaxies > 8 × 10⁴ M⊙, (iv) the two interacting galaxies are disc-dominated (i.e. bulge-to-total ratio < 0.2, and (v) the merger remnant does not already host a nuclear MBH with mass > 5 × 10⁴ M⊙. If all these requirements are met, an 8 × 10⁴ M⊙ seed is formed at the centre of the galaxy.
For reference, Fig. 1 shows the redshift evolution of the number density of newly formed seeds predicted by L-GalaxiesBH. The number density of these objects is primarily dominated by PopIII remnants, reaching values as high as #x223C; 0.1 Mpc−3 at z ∼ 10. The second most numerous population consists of RSM seeds, which begin forming at z ∼ 8 and peak at z ∼ 7, with a maximum number density of ∼ 10−4 Mpc−3. Conversely, DCBHs are the least abundant population. Their formation begins at z ∼ 12 and ends at z ∼ 8, at which point they reach the highest formation rate, with a number density of 10−5 Mpc−3. For simplicity, the figure does not include seeds formed via the miDCBH channel, which occurs at z ≲ 4 and has number densities ≲ 10−5 Mpc−3. Based on these results, the MBH population formed within L-GalaxiesBH is overwhelmingly dominated by PopIII remnants. As will be discussed later, this dominance significantly impacts the formation of the MBH population, since PopIII remnant seeds are expected to form off-centre. Their relatively light mass causes them to drift through the galaxy, far from the galactic nucleus.
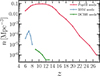 |
Fig. 1. Redshift evolution of the number density of newly formed seeds predicted by L-GalaxiesBH when run on top of the Millennium-II merger trees. Red, blue, and green lines correspond to PopIII remnants, RSM, and DCBH seeds, respectively. |
2.4.2. The growth of MBHs
L-GalaxiesBH assigns a random spin (χ) to each newly formed MBH, whose modulus evolves consistently due to gas accretion and MBH mergers (Izquierdo-Villalba et al. 2020). The growth of MBHs is mainly governed by cold-gas accretion following galaxy mergers or disc instabilities. These events are assumed to drive a fraction of the galaxy’s cold gas component towards the galactic centre. This gas is assumed to form a gas reservoir around the MBH (Mres), which is progressively accreted in two phases (Izquierdo-Villalba et al. 2020, 2024). The first phase is either Eddington-limited or Super-Eddington, depending on the environment in which the MBH is embedded. For large gas reservoirs around the MBH ( ) and large gas inflow after a galactic merger or disc instability (
 ), the MBH triggers a Super-Eddington event, characterised by an Eddington ratio (fEdd = Lbol/LEdd) of
![Mathematical equation: $$ \begin{aligned} f_{\rm Edd} = B(\chi ) \left[\frac{0.985}{\mathrm{\dot{M}_{Edd}/\dot{M}}+C(\chi )}+\frac{0.015}{\mathrm{\dot{M}_{Edd}/\dot{M}}+D(\chi )}\right], \end{aligned} $$](/articles/aa/full_html/2025/11/aa56776-25/aa56776-25-eq15.gif) (3)
(3)
where Ṁ (ṀEdd) is the (Eddington) MBH accretion rate and Lbol (LEdd) is the MBH (Eddington) luminosity. The variables B(χ), C(χ), and D(χ) are taken from Madau et al. (2014). Typical Eddington ratios (Ṁ/ṀEdd ratios) predicted by our model vary between 1 − 4 (10 − 1000). If the super-Eddington conditions are not met, an Eddington-limited growth phase is assumed, where fEdd = 1. The second phase begins when the MBH consumes a fraction of the initial gas mass reservoir and is set to
![Mathematical equation: $$ \begin{aligned} f_{\rm Edd} \,{=}\, \left[1 + \left((t - t_0)/t_Q\right)^{1/2}\right]^{-2/\beta }, \end{aligned} $$](/articles/aa/full_html/2025/11/aa56776-25/aa56776-25-eq16.gif) (4)
(4)
where tQ = td ξβ/(βln10) is the time-scale at which fEdd declines. The parameters are td = 1.26 × 10⁸ yr, β = 0.4, and ξ = 0.3, following Hopkins & Hernquist (2009), who showed that models of self-regulated MBH growth require 0.3 < β < 0.8 and 0.2 < ξ < 0.4. All free parameters involved in MBH growth were calibrated to reproduce the local galaxy-MBH correlation and the stochastic gravitational wave background (sGWB) reported by pulsar timing arrays (PTAs, EPTA Collaboration 2023; Agazie et al. 2023; Reardon et al. 2023).
2.5. Massive black hole binaries
Rather than assuming that MBHs instantly sink to and merge at the galaxy nucleus following a galaxy-galaxy merger, L-GalaxiesBH models the entire lifetime of massive black hole binaries (MBHBs, Izquierdo-Villalba et al. 2022). The evolution of MBHBs is divided into three different phases (Begelman et al. 1980): pairing, hardening, and the gravitational wave phase. The pairing phase begins after the merger of two galaxies. The time spent by the MBH in this phase is computed using the expression of Binney & Tremaine (2008), assuming that the initial separation between the two MBHs corresponds to the radius at which the tidal forces removed 80% of the satellite’s stellar mass. The second and third phases begin when the satellite MBH reaches the galaxy nucleus, and it binds to the central MBH, thus forming an MBHB. The initial binary eccentricity is randomly drawn in the range [0 − 0.99] and the initial semi-major axis is set to the distance at which the stellar content of the galaxy (distributed according to a Sérsic model) equals the mass of the secondary (i.e. lightest) MBH. The eccentricity and separation of the MBHB are then evolved self-consistently depending on whether the environment in which the MBH resides is stellar or gas-dominated (Sesana & Khan 2015; Dotti et al. 2015). For multiple galaxy mergers, triple MBH interactions can occur, the outcome of which is modelled as in Bonetti et al. (2018). Finally, L-GalaxiesBH also accounts for the growth of MBHs and MBHBs during the pairing and hardening phases (see Izquierdo-Villalba et al. 2022, for further details).
3. The off-centred formation and wandering phase of the first MBH seeds
Recent hydrodynamical simulations have shown that light MBH seeds rarely form and reside at the centre of their high-z hosts. Instead, the lack of a deep potential and the irregular morphologies of these galaxies make MBH seeds undergo a random walk in and out of the galactic centre (Smith et al. 2018; Regan et al. 2020; Pfister et al. 2019; Bellovary et al. 2019; Ma et al. 2021). So far, galaxy formation models have generally neglected this off-centre seed formation and the subsequent wandering phase. Here, we present the assumptions adopted to model this feature (hereafter the Off-center model). Specifically, we adapted the model to assess the site at which the first seeds appear and to account for the time required for them to sink to the galactic centre, along with any potential growth phases during this period.
3.1. The formation site of MBH seeds
Determining the initial position where MBH seeds form (r0) is crucial, as it determines the duration of the wandering phase before the seed reaches the galactic nucleus. In our model, we assume that DCBH, miDCBH, and RSMs form at the galactic centre. Their large masses (including the NSC mass for the RSMs) ensure their stability at their host centres (see e.g. Alexander & Natarajan 2014; Biernacki et al. 2017; Pfister et al. 2019). In contrast, for PopIII remnants, we followed the findings of Shi et al. (2015) and Smith et al. (2018), assuming that they form off-centre. Specifically, the high-resolution hydrodynamical simulations by Shi et al. (2015) show that by z ≲ 15, half of the PopIII remnants are located within 10% of the host halo virial radius (Rvir). Furthermore, their radial distribution exhibits a clear peak at ∼ 0.05 Rvir, with a tail extending out to the full virial radius. To reproduce these results, each time a PopIII remnant is formed in a DM halo, its position is randomly chosen according to a log-normal distribution with median 0.1 Rvir and variance 0.85 Rvir. Moreover, to construct an off-centre PopIII formation model that aligns more closely with recent hydrodynamical simulations, we also consider the possibility that multiple PopIII remnants can form off-centre within a single, newly resolved halo (Smith et al. 2018). To achieve this, we used the modifications of multi-PopIII seed formation presented in Spinoso et al. (in prep.). Specifically, this implementation extends the PopIII remnant formation scenario described in Sect. 2.4.1 by allowing a number  of PopIII remnants to form, where
  and MJ denote the cold-gas content and the Jeans mass of the host halo, respectively. We stress that the multi-PopIII formation described here is only part of the Off-center model and is not applied in the Fiducial model. For reference, the distribution of light-seed formation sites is shown in Appendix A. According to the model, > 50% of light seeds form at distances between 100 and 500 pc from the halo (or galaxy) centre.
3.2. The duration of the off-centred phase
To determine the duration of the wandering phase of an MBH seed ( ), we make a very conservative assumption in which the MBH seed is moving inside a spherical and singular isothermal galaxy sphere. Under these conditions, the dynamical friction timescale, tw, can be written as (Binney & Tremaine 2008)
![Mathematical equation: $$ \begin{aligned} t_{\rm w}^\mathrm{BH} \,{=} \, 19 \, f_s \, f(\varepsilon ) \left( \frac{r_0}{5 \, \mathrm {kpc}} \right)^2 \left( \frac{\sigma }{200 \,\mathrm {km/s}}\right) \left( \frac{10^8 \, \mathrm M_{ \odot }}{\mathrm M_{\mathrm {BH}}} \right) \, \frac{1}{\Lambda }\, \mathrm {[Gyr]} , \end{aligned} $$](/articles/aa/full_html/2025/11/aa56776-25/aa56776-25-eq20.gif) (5)
(5)
where r0 is the distance of seed formation from the halo centre (see Section 3.1), f(ε) = ε0.78 is a function that depends on the circularity ε of the MBH orbit (Lacey & Cole 1993), σ is the velocity dispersion of the galaxy, MBH is the mass of the MBH seed, and Λ = ln(1 + Mstellar/MBH) is the Coulomb logarithm (Mo et al. 2010). For simplicity, we fix ε = 0.5. The variable fs is included to mimic the stochastic inspiralling of MBHs observed in simulations of clumpy (gas-rich) and barred galaxies (see Lupi et al. 2015; Tamburello et al. 2017; Pfister et al. 2019; Bortolas et al. 2020, 2022). The parameter fs was introduced in Izquierdo-Villalba et al. (2023) and modelled as a log-normal distribution with a median value of 0.2 and a variance of 0.6. The choice of these values was motivated by the shape of the resulting log-normal distribution, which peaks at ∼1 and features positive skewness. If the MBH seed forms in a gas-rich or barred galaxy, fs is computed from the above distribution. Otherwise, fs is set to 1. The distribution of the time spent by the light seeds wandering within the galaxy after formation is presented in Appendix A. According to the model, over 70% of light seeds wander for more than 1 Gyr before settling at the halo centre. We note that this duration is longer than the Hubble time for z > 6.
Finally, we highlight that the shrinking timescale described by Eq. (5) is a simplified approximation, as it assumes that MBHs evolve within a smooth, spherical, and isothermal potential. In reality, the structure of galaxies is more complex. For example, studies by Pfister et al. (2019), Bellovary et al. (2019), and Ma et al. (2021) show that irregularities in the gas and stellar distributions can lead to gravitational scattering of MBHs, significantly delaying or even preventing their inward migration towards the galactic centre. In addition to galactic structure, the mass of the black hole seed plays a crucial role. Ma et al. (2021) find that low-mass MBH seeds struggle to sink efficiently in typical high-z galaxies and may require embedding within dense stellar clusters to overcome dynamical friction (see also Alexander & Natarajan 2014; Biernacki et al. 2017). Furthermore, Eq. (5) does not account for natal kicks that can be imparted to PopIII MBH seeds at formation. As shown by Whalen & Fryer (2012), such kicks may eject low-mass seeds from their host haloes, severely inhibiting their ability to return and settle in the galactic centre.
3.3. The growth of seeds during the off-centre phase
An important aspect to consider is the growth of MBH seeds during their wandering phase, following their off-centre formation. Analysis of the hydrodynamical Renaissance simulations by Smith et al. (2018) shows that PopIII remnants experience minimal mass increase during their off-centre phase, with a maximum growth of only about 10% relative to their initial seed mass (see also Liu & Bromm 2020 for similar results). In this work, we incorporated these findings by assuming that MBH seeds that form off-centred accrete gas from the galaxy cold gas disc at a fixed Eddington ratio of fEdd = 10−4 (see Figure 3 in Smith et al. 2018). Similarly, during the unresolved growth phase of the PopIII remnants described in Section 2.4.1 (see Eq. (2)), we set the Eddington ratio  .
.
4. Implications of off-centred seed formation in the population of nuclear MBHs
In this section, we investigate how the off-centre formation of MBH seeds impacts the overall MBH population. In particular, we examine the resulting black hole mass and quasar luminosity functions. We then analyse the imprint of off-centre formation and the subsequent wandering phase on the scaling relations at both high and low redshifts. A comprehensive description of the trends observed in the Fiducial model will be presented in Bonoli et al. (in prep.).
4.1. The assembly of MBHs: The black hole mass and quasar luminosity function
The evolution of the MBH mass functions in the Fiducial and Off-center models is shown in Fig. 2. At z ∼ 7, the Fiducial model features more than five times the number of MBHs with masses > 105 M⊙ than the Off-center model. This behaviour changes towards lower redshifts. At z ∼ 5, the Off-center model reduces the difference with the Fiducial model by a factor of ∼2 − 3 for objects with 105 < MBH < 108.5 M⊙. This trend continues at 3 < z < 5 for MBHs with MBH > 108.5 M⊙ but differences increase again in the range 104 M⊙ < MBH < 106 M⊙, where the Fiducial model predicts up to ten times larger abundances. As expected, this behaviour is driven by the off-centred seed formation, which delays the assembly of intermediate-mass MBHs. By z ∼ 2, the two models show similar abundances at > 108.5 M⊙, and the differences are reduced to less than a factor of two for MBHs with 104 M⊙ < MBH < 105M⊙. Nevertheless, the Off-center model still predicts approximately three times fewer MBHs at 106 M⊙ < MBH < 108 M⊙ than the Fiducial model. Finally, at z ≤ 1, both models exhibit similar behaviour, showing a good agreement with the observational constraints of Shankar et al. (2013) and Liepold & Ma (2024), highlighting that off-centre seed formation has a minimal impact on the abundance of low-z MBHs. The only notable difference at z ≤ 1 occurs for masses < 106 M⊙, where the Fiducial model predicts approximately 1.5 times more objects than the Off-center model. The convergence between the two models at low redshift is primarily driven by the fact that MBHs initially formed off-centre have had sufficient time to migrate toward the galactic nucleus. This convergence occurs earlier for more massive black holes, as they reside in more massive galaxies whose deeper gravitational potentials and denser stellar environments enable more efficient inward migration. In contrast, low-mass galaxies are less effective at facilitating this process, leading to delayed convergence at the low-mass end of the MBH mass function. Moreover, the peak of the galaxy merger rate occurs at lower redshifts in less massive systems. As a result, MBHs in low-mass galaxies typically wait longer for a merger event capable of efficiently triggering their growth, once they reach the galactic nucleus (see, e.g. Fig. 8 in Volonteri et al. 2020).
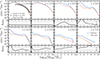 |
Fig. 2. Upper panels: Black hole mass function (BHMF) at z = 0, 1, 2, 3, 4, 5, 6, and 7. The results correspond to the L-GalaxiesBH SAM run on the Millennium merger trees after applying the grafting methodology presented in Section 2.2. The z = 0 observations correspond to Shankar et al. (2013), Shen et al. (2020), and Liepold & Ma (2024). Blue and orange lines represent the Fiducial and Off-center model predictions, respectively. Shaded areas show the Poisson error. Lower panels: Ratio between the predictions of the Off-center and Fiducial models. The horizontal grey lines are placed at 1, 2, and 5. |
In addition to MBH assembly, off-centred seed formation can influence the observable population of accreting MBHs. To investigate this, Fig. 3 shows the evolution of the predicted quasar bolometric luminosity functions (LFs). These predictions are compared with observational data from Shen et al. (2020), which compiles infrared, optical, UV, and X-ray measurements; Barlow-Hall & Aird (2025), which gathers X-ray data; and recent JWST results from Akins et al. (2025), Greene et al. (2024), Matthee et al. (2024), and Kokorev et al. (2024). It is important to emphasise that the JWST LFs presented here consist of samples of little red dots (LRDs), which implies that not all objects in the sample are necessarily AGNs3. Similar to the mass function, the most significant differences appear at high-z. Specifically, at 6 < z < 7 the Off-center model predicts about five to ten times fewer active MBHs than the Fiducial model, regardless of luminosity. This behaviour is expected, as the Off-center model shows a lower number density of MBHs with > 104, M⊙, as seen in Fig. 2. Interestingly, the Fiducial model aligns better with the observed high-z LF, especially when constrained by the photometrically selected JWST objects (Kokorev et al. 2024; Akins et al. 2025). At z = 5, differences between the two models persist, but decrease to about a factor of two at luminosities at 1044−45 erg/s and above 1047 erg/s. Despite these differences, both models generally agree well with the LFs reported in Greene et al. (2024), Kokorev et al. (2024), and Akins et al. (2025). At z = 3, both models produce similar results for luminosities > 1046 erg/s. However, differences become more pronounced at lower luminosities (1043−44 erg/s), with the Fiducial model predicting up to ten times more objects than the Off-center model. The lower number of low-luminosity MBHs in the Off-center model better reproduces the LF shape observed in Shen et al. (2020). Similar trends are observed at z = 2, although the differences at low luminosities almost disappear. By z = 0.5, the trend reverses: the Off-center model predicts about 1.5 times more active MBHs than the Fiducial model. This shift results from the delayed assembly of the MBH population in the Off-center model, which causes massive galaxies to quench later. Consequently, MBHs in the Off-center scenario tend to reside in galaxies with larger gas reservoirs, allowing sustained MBH accretion over longer periods following galaxy mergers or secular processes.
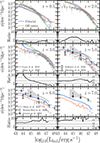 |
Fig. 3. Upper panels: Quasar luminosity function at z = 0.5, 2, 3, 5, 6, and 7 predicted by the Fiducial (blue) and Off-center (orange) models. The results of L-GalaxiesBH are presented for the Millennium trees with the grafting methodology. Shaded areas show the Poisson error. Observational data correspond to Shen et al. (2020), Lacy et al. (2015), Kokorev et al. (2024), Greene et al. (2024), Matthee et al. (2024), Akins et al. (2025), and Barlow-Hall & Aird (2025). Lower panels: Ratio between the predictions of the Off-center and Fiducial models. The horizontal grey lines are placed at 0.5, 1, 2, and 5 to guide the eye. Upper panels: Quasar luminosity function at z = 0.5, 2, 3, 5, 6, and 7 predicted by the Fiducial (blue) and Off-center (orange) models. The results of L-GalaxiesBH are presented for the Millennium trees with the grafting methodology. Shaded areas show the Poisson error. Observational data correspond to Shen et al. (2020), Lacy et al. (2015), Kokorev et al. (2024), Greene et al. (2024), Matthee et al. (2024), Akins et al. (2025), and Barlow-Hall & Aird (2025). Lower panels: Ratio between the predictions of the Off-center and Fiducial models. The horizontal grey lines are placed at 0.5, 1, 2, and 5 to guide the eye. |
In summary, off-centre MBH seed formation does not hinder the assembly of an MBH population consistent with current observational constraints of low-z (active and inactive) MBHs. However, significant differences emerge at high-z (z > 6), particularly in the quasar LF. Therefore, obtaining a robust observational estimate of the number density of MBHs with bolometric luminosities 1044−47 erg/s at z > 6 (a range our model indicates could vary by up to a factor of five) is essential to constrain the early growth and dynamics of the first MBH seeds.
4.2. The galaxy and massive black hole scaling relation
Studies at low-z have shown a correlation between black hole mass and host galaxy stellar mass. This relation is thought to arise from the simultaneous growth of galaxies and nuclear MBHs, regulated by AGN feedback, during galaxy mergers or secular processes (e.g. Di Matteo et al. 2005; Croton 2006). To better understand this relation, predictions from the Fiducial model are presented in Fig. 4. First, we compare these predictions with observational data to establish a baseline. We then discuss the differences introduced by the off-centre model, which are examined in subsequent analyses. At z ≥ 5, the median relation of the Fiducial model falls below the recent constraints derived from JWST data (Maiolino et al. 2024; Harikane et al. 2023; Ding et al. 2023). Specifically, typical MBHs in galaxies of 108 < MStellar < 109 are ∼ 4 dex smaller (102−4 M⊙) than current observational estimates (#x223C; 106 M⊙). This discrepancy is less pronounced at higher stellar masses (MStellar > 109 M⊙), where the model predictions show some agreement with high-z objects. Since JWST only selects active MBHs (such as broad-line AGNs; see e.g. Harikane et al. 2023; Maiolino et al. 2024; Matthee et al. 2024), the right panel of Fig. 4 offers a fairer comparison by showing the scaling relation for galaxies hosting MBHs with bolometric luminosities Lbol > 1044 erg/s. The population of active MBHs predicted by the Fiducial model is > 2σ away from the relation of the full MBH population (left panel) and aligns well with high-z AGNs. This suggests that active high-z MBHs occupy a distinct region in the relation (more than 2σ beyond the median relation) compared to the overall MBH population (see discussion in Lauer et al. 2007; Reines & Volonteri 2015, for differences in the scaling relation due to biases or intrinsic differences). Finally, the Fiducial model predictions at low-z (z < 2) match well with constraints provided by Erwin & Gadotti (2012), Reines & Volonteri (2015), and Capuzzo-Dolcetta & Tosta e Melo (2017). We note that at z = 2 there are some differences between the model and observations, possibly because Suh et al. (2020) data correspond to broad-line AGNs, selected according to several specific cuts. In contrast, our median corresponds to the entire MBH population.
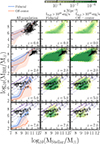 |
Fig. 4. Scaling relations at predicted by L-GalaxiesBH applied in the Millennium trees with the grafting methodology. Left panel: Median black hole mass (MBH) at fixed stellar mass (MStellar). The shaded areas correspond to the 16th–84th percentiles. Blue colours represent the results for the Fiducial model while orange corresponds to the Off-center model. Central and right panels: MBH − MStellar plane for MBHs with Lbol > 1044 erg/s. These populations extend far beyond the 16th–84th percentiles. The observational constraints are: at z = 0, from Erwin & Gadotti 2012 (squares) Reines & Volonteri 2015 (diamonds), and Capuzzo-Dolcetta & Tosta e Melo 2017 (circles); at z = 2, from Suh et al. 2020 (pentagons); and at z ≥ 5, from Maiolino et al. 2024 (circles), Harikane et al. 2023 (squares), and Ding et al. 2023 (stars). |
Since the correlation between MBHs and galaxies stems from their synchronised growth, the off-centre periods included in the Off-center model could disrupt or modify the scaling relation observed in the Fiducial case. To investigate this, the left panel of Fig. 4 shows in orange the predicted scaling relation from the Off-center model. Overall, the trend is similar to that of the Fiducial case; however, the normalisation of the relation is notably affected and exhibits a redshift evolution. At 5 < z < 7, the Off-center model predicts smaller MBHs at a given stellar mass. The difference is typically ∼ 0.5 dex, but can reach up to ∼ 2 dex at z = 7 for galaxies with 109 < MStellar < 109.5 M⊙. By z = 2, the correlation predicted by the Off-center model aligns with that of the Fiducial model for galaxies with MStellar > 1010M⊙. For smaller systems, the Off-center model predicts lighter MBHs, with differences of up to 2 dex. This systematic offset disappears by z = 0, where the two models converge. Regarding AGNs, the right panel of Fig. 4 shows that the predictions of the Off-center model are similar to those of the Fiducial model, remaining consistent with the existence of overmassive high-z objects reported by Maiolino et al. (2024) and Harikane et al. (2023). Based on these findings, the model predicts that off-centre MBH formation plays a significant role in shaping the correlation between MBHs and galaxies at high redshift (z > 5). Although the number density of the biased population of active MBHs is affected (see Fig. 3), the expected correlation between the MBH mass and the galaxy mass remains unchanged. As these MBHs are the only group currently observable, the existing constraints on galaxy-MBH scaling relations at high-z derived from JWST data do not provide strong insights into the early stages of MBH seed formation and their initial dynamics.
4.3. The mass contribution from gas accretion
The left panel of Fig. 5 shows the fraction of mass gained by MBHs through gas accretion, compared with the mass gained by mergers. As illustrated, there is a general trend: the lower the MBH mass, the larger the proportion of mass gained via gas accretion. However, differences emerge when comparing the Fiducial and Off-center models. For systems with MBH < 107M⊙, the main distinctions appear at high-z (z > 3), where the Off-center model predicts a smaller fraction of mass gained through gas accretion than the Fiducial model. Although these differences are relatively small, there is a systematic trend. These high-z differences increase towards larger masses and reach their maximum for objects with > 108 M⊙. In this range, the Fiducial model predicts a gas contribution of approximately 80%, whereas the Off-center model predicts about 70%. At z < 2, there are also some differences in MBHs with MBH > 107M⊙. Specifically, the Off-center model tends to predict larger gas contributions than the Fiducial model. This is related to the trends discussed in previous sections, where off-centre seed formation delays the assembly of MBHs and causes galaxies to quench later. As a result, galactic mergers or disc instabilities supply larger gas reservoirs around the MBHs than in the model where seeds form in the galactic centre.
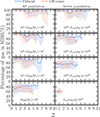 |
Fig. 5. Fraction of mass acquired by the MBH via gas accretion. The left panels represent the entire MBH population divided in mass bins, while the right panel is restricted to active MBHs divided in different bolometric luminosities. Orange and blue lines represent the results for the Fiducial and Off-center models, respectively. Shaded areas correspond to the 16th–84th percentiles of the distribution. |
The right panel of Fig. 5 presents the same analysis restricted to the active MBH population (Lbol > 1044 erg/s). The trends are similar to those described above, but the active population features slightly smaller differences between the Fiducial and Off-center models. These trends suggest that off-centre formation and subsequent wandering of the first seeds influence the mass that MBHs gain through gas accretion, increasing the importance of mass acquired via MBH mergers. Despite this, we do not find any specific mass greater than 104 M⊙, luminosity greater than 1044 erg/s, or redshift at which mergers dominate over mass gained from gas accretion.
4.4. The population of ungrown MBHs at high-z
As discussed in the previous sections, off-centre periods of MBH seeds delay the assembly of the MBH population. Here, we examine the percentage of MBHs that grow substantially at high-z. To quantify this, we use the variable 𝒢, which is defined as:
 (6)
(6)
where MBH(z) is the mass of the MBH at the current redshift and MBH(zf) corresponds to the formation time (i.e. the seed mass). Fig. 6 shows the percentage of the MBH population that grew by at least a factor 𝒢 relative to its initial seed mass. Here, the full population includes MBHs located at galaxy centres, as well as those that are off-centre, wandering within the galaxy disc following a galaxy merger or off-centre formation. Although both models show an increasing fraction of MBHs that have grown to a significant portion of their initial mass over time, notable differences remain between them. At z = 9, the Fiducial model predicts that only about 10−3% of the entire population has grown by a factor 102 < 𝒢 < 103. In contrast, at the same redshift, the Off-center model predicts an even lower value: less than 10−4%. By redshift z = 7, this fraction rises to approximately 0.01% in the Fiducial model, while in the Off-center model it remains as low as 2 × 10⁻⁴%. At z = 4, the percentage varies significantly depending on the growth factor 𝒢. For example, when 𝒢 > 102 (𝒢 > 103), the Fiducial model predicts that approximately 10% (0.1%) of the population has undergone substantial growth. These numbers decrease considerably in the Off-center model, where only about 0.1% (0.01%) of the population has grown by the same factor.
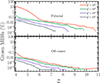 |
Fig. 6. Redshift evolution of the percentage of MBHs that have grown at least a fraction 𝒢 of their initial seed mass. The upper and lower panels show the Fiducial and Off-center models, respectively. Different colours correspond to different 𝒢 values. |
These results align with findings from previous sections, emphasising that off-centre seed formation hampers the build-up of a significant population of intermediate-mass black holes in the early Universe (z > 4). These small MBHs must wait until later times to sink into galactic centres, where they can undergo substantial accretion episodes that significantly increase their masses. Similar conclusions are reached in the hydrodynamical simulation of Smith et al. (2018), which shows that the remaining PopIII seeds exhibit very inefficient growth at 9 < z < 15. The authors report that, on average, these MBH seeds increased their initial mass by a factor of 10−5, with the most active seeds growing by approximately 10% (see also Liu & Bromm 2020). Additionally, Pfister et al. (2019) supports these findings. They show that high-z MBHs with masses < 105 M⊙ are scattered throughout the galaxy due to irregularities in the gas and stellar potential. This causes them to oscillate around the galaxy centre, keeping them away from dense gas regions and thereby inhibiting significant accretion events.
5. The population of MBHBs in the LISA band
The off-centre formation of the first MBH seeds can also directly affect the population of MBHBs. This section explores how binaries emitting gravitational waves (GWs) in the LISA (The Laser Interferometer Space Antenna) band are affected. No significant effects are seen in the PTA band (nHz) because the Fiducial and Off-center models predict very similar MBH populations with masses > 108 at z < 1 (see Fig. 2).
The future LISA detector will observe the GWs emitted by the coalescence of MBHBs with 104 < MBH < 107M⊙, a mass range affected by the off-centre formation of the first MBH seeds (see Section 4). Owing to the high sensitivity of the detector, it will be possible to assess whether the detections align more closely with the predicted MBH merger rates of the Off-center or Fiducial models. However, given the current uncertainties in MBH formation and subsequent build-up, it may be difficult, if not impossible, to isolate the impact of off-centre formation from the LISA data. Because L-GalaxiesBH evolves a limited comoving volume of the Universe, we can extract the quantity dn/dz from the simulation, representing the number of MBHB mergers per redshift and comoving volume. This quantity can be used to compute the binary merger rate across the Universe as
![Mathematical equation: $$ \begin{aligned} \frac{d\mathrm{N} }{dzdt} \,{=}\, \left[\frac{4\pi \, c \, d_L^2}{(1+z)^2}\right] \left(\frac{dn}{dz}\right), \end{aligned} $$](/articles/aa/full_html/2025/11/aa56776-25/aa56776-25-eq23.gif) (7)
(7)
where z is the merger redshift, c is the light speed, and dL is the source luminosity distance. Since we are interested in LISA detection rates, we count in dn/dz only systems with S/N above a threshold set of 7 (see Colpi et al. 2024). The sky-averaged S/N assigned for each MBHBs is computed as:
![Mathematical equation: $$ \begin{aligned} \mathrm{SNR} \,{=}\, \left(\frac{16}{5}\, \int _{ f _0}^{ f_f } \left[ \frac{ h _c( f ^{\prime }_{obs})}{ h _n( f ^{\prime }_{obs})}\right]^{2} \frac{ df ^{\prime }_{obs}}{ f ^{\prime }_{obs}} \right)^{1/2}, \end{aligned} $$](/articles/aa/full_html/2025/11/aa56776-25/aa56776-25-eq24.gif) (8)
(8)
where hn is the characteristic strain noise parametrised as in Babak et al. (2021), and hc is the characteristic strain amplitude of the source. The latter is defined as  , where
  is the Fourier transform of the strain signal, computed using the phenomenological frequency-domain gravitational waveform model PhenomC (Santamaría et al. 2010). The value of f0 represents the starting frequency of inspiralling binaries, set randomly between [0 − Tobs], with Tobs = 4 yr being the duration of LISA observations. The maximum signal frequencyff is 0.15c3/G(1 + z) MBin, where MBin is the total binary mass. The resolution frequency bin, df, used to integrate Eq. 8 is set to df = 1/Tobs. The effective spin of the MBHBs is taken from the L-GalaxiesBH predictions, and the eccentricity is set to 0, for simplicity.
The predicted merger rates from the Fiducial and Off-center models are shown in Fig. 7. Overall, the merger rate for the former is ∼ 36 yr−1 while for the latter the rate is ∼ 15 yr−1. These differences become clear when the population is divided by mass. For binaries with 104 < MBin < 105M⊙, the Fiducial model predicts that the first detected mergers occur at z ∼ 7 (∼0.01 yr−1), peak at z ∼ 4 (∼1.1 yr−1), and decline rapidly by z ∼ 0 (∼10−3 yr−1). In contrast, the Off-center model shows a different behaviour. At z > 3, mergers are significantly suppressed, with rates five to ten times lower than those predicted by the Fiducial model. At lower redshifts, the detection rate increases, peaking at z ∼ 1.5, where it is ten times larger (∼ 4 yr−1) than that of the Fiducial model. Interestingly, when the rates within this mass range are integrated over all redshifts, the Off-center model predicts a value approximately 2.5 times higher than the Fiducial case. For systems with 105 < MBin < 106M⊙, the scenario is very similar. While the Fiducial model predicts that detected coalescences begin at z ∼ 5 (∼ 0.1 yr−1) and peak at z ∼ 3 (∼ 1 yr−1), the Off-center model exhibits a suppression of high-z mergers (z ≥ 3) in favour of an enhancement at 1 < z < 2 (∼ 2 yr−1). As before, when the mergers are integrated over redshifts, the Off-center model predicts a factor of two more events than the Fiducial model. Finally, for MBHBs with 106 < MBin < 107M⊙, the picture is similar, although the integrated merger rates of the two models are comparable.
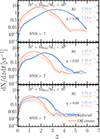 |
Fig. 7. Merger rate of MBHBs detected by LISA with S/N > 7. Each panel corresponds to merged binaries with different total mass (MBin). Blue lines show the predictions of the Fiducial model, while orange lines show those of the Off-center model. Pale lines represent the merger rates related to merging binaries with mass ratio q > 0.05 is assumed. The results were produced with L-GalaxiesBH applied in the Millennium-II simulation. The numbers inside each panel correspond to the integrated merger rate with all and mass-cut (q) MBHs in a given mass bin. |
As described above, the differences between the Fiducial and Off-center models can be summarised by two main features: a suppression of events at high-z and an enhancement at low-z. The first trend results directly from off-centre seed formation, which allows only a few high-z galaxies to host nuclear MBHs. Consequently, when MBHs reach the centre of their galaxies following a galaxy merger and a dynamical friction phase, very few encounter another nuclear MBH to form a binary system. The second trend arises from a combination of delayed MBH growth and the multi-PopIII seeding introduced in Section 3. The delayed assembly of MBHs results in longer sinking timescales for the population, meaning that they spend extended periods in the dynamical friction phase after a galaxy merger. Consequently, the formation and eventual merger of MBHBs take longer in the Off-center model than in the Fiducial model. Additionally, multi-PopIII seeding in the Off-center model results in galaxies hosting more light seeds that wander within the galaxy compared to the Fiducial model. As a result, some of these seeds reach the galaxy centre at low-z and increase the merger rate. These two factors imply a lighter MBHB population reaching the galactic nucleus. This is illustrated in Fig. 8, which shows the mass ratio, q = MBH,2/MBH,1, of MBHBs detected by LISA. For systems with total mass 104 < MBin < 105M⊙, the Fiducial model predicts mergers with nearly equal masses, with a median q ∼ 1. In contrast, the q values in the Off-center scenario extend down to 10−3, corresponding to intermediate-mass-ratio inspirals (IMRIs), with a median value approximately ten times smaller (q ∼ 0.1) than in the Fiducial model. Similar trends are seen in the other two mass bins explored. For t105 < MBin < 106M⊙ (106 < MBin < 107M⊙), the Fiducial model finds mergers with typical q ∼ 0.5 (q ∼ 0.09), whereas the Off-center case has q ∼ 3 × 10⁻³ (q ∼ 7 × 10⁻⁴).
Fig. 8 shows that a considerable number of mergers in the Off-center model involve systems with mass ratios small enough to qualify as IMRIs. Currently, accurate waveform models for q ≲ 0.05 are not fully developed (see e.g. Babak et al. 2017; Hinder et al. 2018), which limits our ability to precisely characterise the merging signals of these systems. Therefore, it is more appropriate to focus on merger rates for which the mass ratio exceeds this threshold, ensuring reliable waveform modelling and parameter estimation4. The results for q > 0.05 are shown with pale lines in Fig. 7. As expected, the merger rates in the Fiducial model remain unaffected by this q-value cut. In contrast, the Off-center model is significantly affected, particularly for systems with higher total mass. Overall, the merger rates decrease by a factor of three to nine, resulting in the Fiducial model predicting more mergers than the Off-center model.
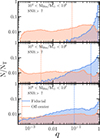 |
Fig. 8. Binary mass ratio, q, of merging MBHBs detected by LISA with S/N > 7. Each panel shows merged binaries with different total mass (MBin). Blue histograms represent the predictions of the Fiducial model and orange histograms represent those of the Off-center model. Horizontal dashed lines highlight the median value of the distribution. The results were produced using L-GalaxiesBH applied to the Millennium-II simulation. |
In conclusion, LISA may have the potential to reveal and constrain the physical process of off-centre seed formation. If this process plays a significant role in the evolution of the first MBHs, LISA is expected to detect fewer nearly equal-mass mergers than initially anticipated and these would primarily occur at low-z. However, these features may not be unique to off-centre seeding, as other physical processes could potentially lead to similar observational signatures.
6. Conclusions
By using the state-of-the-art semi-analytical model L-GalaxiesBH applied to the Millennium suite of simulations, we have studied how off-centre MBH seed formation affects the global populations of MBHs and MBHBs. To this end, we have extended the regular galaxy formation model of L-GalaxiesBH (Fiducial model) by assuming that light seeds (PopIII remnants) do not form in the galactic centre but are distributed in the minihalo where they are born. This assumption implies that light does not meet ideal conditions for growth by mergers and gas accretion at birth, resulting in a delay in their mass evolution (Off-center model). The main findings of this work can be summarised as follows:
-
Off-centre seed formation significantly affects the assembly of the MBH population. At high-z (z > 4), the abundances of MBHs with > 105 M⊙ are suppressed by a factor of between two and ten compared to the Fiducial model. This implies that at these redshifts, less than 0.01% of the entire MBH population is able to grow. At lower-z (z < 2), the differences in the > 105 M⊙ MBH population have almost vanished since the predictions of the Off-center and Fiducial models converge to similar results.
-
Quasar AGN luminosity functions are affected by off-centre seed formation. At z > 6, the Off-center model predicts five times fewer systems with Lbol > 1044 erg/s compared to the Fiducial model. At lower redshifts, the two models generally converge, although the Off-center model predicts slightly more sources. This is because the delayed assembly of MBHs results in less effective galaxy quenching. As a result, galaxies have more gas available to feed MBHs, allowing them to stay active for a longer period.
-
Important differences are seen in MStellar − MBH correlation. At z > 5, the amplitude predicted by the Off-center model is lower than in the Fiducial model, with MBHs up to 2 dex smaller at fixed stellar mass. At z ∼ 2 this difference disappears for galaxies with MStellar > 1011M⊙ but persists in systems with smaller mass. In the local Universe, the differences between the two models vanish, with no signature of the off-centre formation left in the scaling relation. Moreover, the overmassive population of MBHs recently discovered by JWST is present in both Fiducial and Off-center models and exhibits a very similar MStellar − MBH scaling relation. Therefore, the correlation of this population with their host cannot constrain any off-centre formation of MBHs.
-
The rate of MBH mergers in the LISA band (104 < MBH < 107M⊙) is significantly influenced by off-centre seed formation. This scenario leads to a suppression of events at high redshift and an enhancement at low redshift compared to the Fiducial model. The Off-center model exhibits a higher overall merger rate (∼ 36 yr−1) compared to the Fiducial model (∼15 yr−1). This difference is primarily driven by a larger number of IMRIs in the Off-center model. However, when applying a mass ratio threshold of > 0.05, the Fiducial model predicts a greater number of detectable events. These trends suggest that LISA could potentially constrain off-centre seed formation and the early dynamical evolution of MBHs. Nonetheless, these features may not be unique to off-centre seeding, as other physical processes could potentially lead to similar observational signatures.
The results presented here represent the first statistical assessment of the effects of off-centre seed formation and the subsequent wandering phase on the MBH and MBHB populations. Further investigation is nevertheless required. Combining semi-analytical models with hydrodynamical simulations that do not reposition MBHs at the galactic centre (Dubois et al. 2014, 2021; Tremmel et al. 2017; Trebitsch et al. 2021) will enable a better understanding of the dynamical evolution of the first seeds within galaxies.
Stellar-evolution models predict that only stars with mass MPopIII > 25 M⊙ can produce a PopIII remnant, provided that their mass lies outside the interval 140 < MPopIII/M⊙ < 260, where pair-instability leads to the complete destruction of stars at the end of their life (e.g. Heger & Woosley 2002).
The typical formation redshift of the PopIII MBH seeds in our model is approximately zf ∼ 23 (6.3 < zf < 35). The usual growth factor is ∼5 × MBH(zf), with a maximum factor of ∼30 × MBH(zf).
The sample of Greene et al. (2024) is most likely composed of AGNs, as the LRDs are selected by colour compactness and the presence of broad-line emissions. Kokorev et al. (2024) uses the same colour selection as Greene et al. (2024), but does not check for broad lines. Akins et al. (2025) uses different colour selections than in the two previous cases and considers two extremes: the LRDs are all AGNs or all galaxies. Matthee et al. (2024) selects the sample by looking for broad line emissions in slitless and grism spectroscopy, implying that is the best approach to obtain an actual AGN luminosity functions.
It is also important to note that if the S/N is sufficiently high, the detection of IMRIs may remain feasible even with less accurate waveform templates (Babak et al. 2017). Nonetheless, the primary challenge is potential biases introduced in parameter estimation if waveform models are not sufficiently accurate for these systems (Hinder et al. 2018). This underscores the critical need for precise IMRI waveform models, which will improve both detection prospects and the robustness of astrophysical inferences from future GW observations.
Acknowledgments
We thank the B-Massive group at Milano-Bicocca University for useful discussions and comments. D.I.V. thanks John Wise for his useful discussion about the birthplace of the first light seeds. D.I.V and A.S. acknowledge the financial support provided under the European Union’s H2020 ERC Consolidator Grant “Binary Massive Black Hole Astrophysics” (B Massive, Grant Agreement: 818691) and the European Union Advanced Grant “PINGU” (Grant Agreement: 101142079). M.V. acknowledges funding from the French National Research Agency (grant ANR-21-CE31-0026, project MBH_waves) and from the Centre National d’Etudes Spatiales. M.C. acknowledges funding from MIUR under the grant PRIN 2017-MB8AEZ, from the INFN TEONGRAV initiative, and from the MUR Grant “Progetto Dipartimenti di Eccellenza 2023–2027” (BiCoQ). D.S. acknowledges support by the Fondazione ICSC, Spoke 3 Astrophysics and Cosmos Observations. National Recovery and Resilience Plan (Piano Nazionale di Ripresa e Resilienza, PNRR) Project ID CN_00000013 “Italian Research Center on High-Performance Computing, Big Data and Quantum Computing” funded by MUR Missione 4 Componente 2 Investimento 1.4: Potenziamento strutture di ricerca e creazione di “campioni nazionali di R&S (M4C2-19 )” – Next Generation EU (NGEU). S.B. acknowledges support from the Spanish Ministerio de Ciencia e Innovación through project PID2021-124243NB-C21. M.V. acknowledges funding from the French National Research Agency (grant ANR-21-CE31-0026, project MBH_waves) and from the Centre National d’Etudes Spatiales.
References
- Abel, T., Bryan, G. L., & Norman, M. L. 2000, ApJ, 540, 39 [NASA ADS] [CrossRef] [Google Scholar]
- Agazie, G., Anumarlapudi, A., Archibald, A. M., et al. 2023, ApJ, 951, L8 [NASA ADS] [CrossRef] [Google Scholar]
- Akins, H. B., Casey, C. M., Lambrides, E., et al. 2025, ApJ, 991, 37 [Google Scholar]
- Alexander, T., & Natarajan, P. 2014, Science, 345, 1330 [NASA ADS] [CrossRef] [Google Scholar]
- Angulo, R. E., & White, S. D. M. 2010, MNRAS, 405, 143 [NASA ADS] [Google Scholar]
- Angulo, R. E., White, S. D. M., Springel, V., & Henriques, B. 2014, MNRAS, 442, 2131 [Google Scholar]
- Ayromlou, M., Nelson, D., Yates, R. M., et al. 2021, MNRAS, 502, 1051 [NASA ADS] [CrossRef] [Google Scholar]
- Babak, S., Gair, J., Sesana, A., et al. 2017, Phys. Rev. D, 95, 103012 [NASA ADS] [CrossRef] [Google Scholar]
- Babak, S., Hewitson, M., & Petiteau, A. 2021, arXiv e-prints [arXiv:2108.01167] [Google Scholar]
- Bañados, E., Venemans, B. P., Mazzucchelli, C., et al. 2018, Nature, 553, 473 [Google Scholar]
- Barlow-Hall, C. L., & Aird, J. 2025, MNRAS, submitted [arXiv:2506.16145] [Google Scholar]
- Begelman, M. C., Blandford, R. D., & Rees, M. J. 1980, Nature, 287, 307 [Google Scholar]
- Begelman, M. C., Volonteri, M., & Rees, M. J. 2006, MNRAS, 370, 289 [NASA ADS] [CrossRef] [Google Scholar]
- Bellovary, J. M., Cleary, C. E., Munshi, F., et al. 2019, MNRAS, 482, 2913 [NASA ADS] [Google Scholar]
- Biernacki, P., Teyssier, R., & Bleuler, A. 2017, MNRAS, 469, 295 [Google Scholar]
- Binney, J., & Tremaine, S. 2008, Galactic Dynamics: Second Edition (Princeton University Press) [Google Scholar]
- Bonetti, M., Sesana, A., Barausse, E., & Haardt, F. 2018, MNRAS, 477, 2599 [NASA ADS] [CrossRef] [Google Scholar]
- Bonoli, S., Mayer, L., & Callegari, S. 2014, MNRAS, 437, 1576 [NASA ADS] [CrossRef] [Google Scholar]
- Bonoli, S., Izquierdo-Villalba, D., Spinoso, D., et al. 2025, A&A, submitted [arXiv:2509.12325] [Google Scholar]
- Bortolas, E., Capelo, P. R., Zana, T., et al. 2020, MNRAS, 498, 3601 [Google Scholar]
- Bortolas, E., Bonetti, M., Dotti, M., et al. 2022, MNRAS, 512, 3365 [NASA ADS] [CrossRef] [Google Scholar]
- Boylan-Kolchin, M., Springel, V., White, S. D. M., Jenkins, A., & Lemson, G. 2009, MNRAS, 398, 1150 [Google Scholar]
- Bromm, V. 2013, Asociacion Argentina de Astronomia La Plata Argentina Book Series, 4, 3 [Google Scholar]
- Bromm, V., & Larson, R. B. 2004, ARA&A, 42, 79 [NASA ADS] [CrossRef] [Google Scholar]
- Capuzzo-Dolcetta, R., & Tosta e Melo, I. 2017, MNRAS, 472, 4013 [CrossRef] [Google Scholar]
- Chon, S., & Omukai, K. 2020, MNRAS, 494, 2851 [Google Scholar]
- Colpi, M., Danzmann, K., Hewitson, M., et al. 2024, arXiv e-prints [arXiv:2402.07571] [Google Scholar]
- Croton, D. J. 2006, MNRAS, 369, 1808 [NASA ADS] [CrossRef] [Google Scholar]
- Devecchi, B., & Volonteri, M. 2009, ApJ, 694, 302 [NASA ADS] [CrossRef] [Google Scholar]
- Devecchi, B., Volonteri, M., Rossi, E. M., Colpi, M., & Portegies Zwart, S. 2012, MNRAS, 421, 1465 [NASA ADS] [CrossRef] [Google Scholar]
- Di Matteo, T., Springel, V., & Hernquist, L. 2005, Nature, 433, 604 [NASA ADS] [CrossRef] [Google Scholar]
- Ding, X., Onoue, M., Silverman, J. D., et al. 2023, Nature, 621, 51 [NASA ADS] [CrossRef] [Google Scholar]
- Dotti, M., Merloni, A., & Montuori, C. 2015, MNRAS, 448, 3603 [NASA ADS] [CrossRef] [Google Scholar]
- Dubois, Y., Volonteri, M., & Silk, J. 2014, MNRAS, 440, 1590 [Google Scholar]
- Dubois, Y., Beckmann, R., Bournaud, F., et al. 2021, A&A, 651, A109 [NASA ADS] [CrossRef] [EDP Sciences] [Google Scholar]
- Ebisuzaki, T., Makino, J., Tsuru, T. G., et al. 2001, ApJ, 562, L19 [NASA ADS] [CrossRef] [Google Scholar]
- EPTA Collaboration (InPTA Collaboration, et al.) 2023, A&A, 678, A50 [CrossRef] [EDP Sciences] [Google Scholar]
- Erwin, P., & Gadotti, D. A. 2012, Adv. Astron., 2012, 946368 [Google Scholar]
- Geris, S., Maiolino, R., Isobe, Y., et al. 2025, arXiv e-prints [arXiv:2506.22147] [Google Scholar]
- Greene, J. E., Labbe, I., Goulding, A. D., et al. 2024, ApJ, 964, 39 [CrossRef] [Google Scholar]
- Haehnelt, M. G., & Rees, M. J. 1993, MNRAS, 263, 168 [Google Scholar]
- Haemmerlé, L., Woods, T. E., Klessen, R. S., Heger, A., & Whalen, D. J. 2018, MNRAS, 474, 2757 [Google Scholar]
- Harikane, Y., Zhang, Y., Nakajima, K., et al. 2023, ApJ, 959, 39 [NASA ADS] [CrossRef] [Google Scholar]
- Häring, N., & Rix, H.-W. 2004, ApJ, 604, L89 [Google Scholar]
- Heger, A., & Woosley, S. E. 2002, ApJ, 567, 532 [Google Scholar]
- Henriques, B. M. B., White, S. D. M., Thomas, P. A., et al. 2015, MNRAS, 451, 2663 [Google Scholar]
- Henriques, B. M. B., Yates, R. M., Fu, J., et al. 2020, MNRAS, 491, 5795 [NASA ADS] [CrossRef] [Google Scholar]
- Hinder, I., Kidder, L. E., & Pfeiffer, H. P. 2018, Phys. Rev. D, 98, 044015 [Google Scholar]
- Hopkins, P. F., & Hernquist, L. 2009, ApJ, 698, 1550 [NASA ADS] [CrossRef] [Google Scholar]
- Inayoshi, K., Visbal, E., & Haiman, Z. 2020, ARA&A, 58, 27 [NASA ADS] [CrossRef] [Google Scholar]
- Izquierdo-Villalba, D., Bonoli, S., Dotti, M., et al. 2020, MNRAS, 495, 4681 [NASA ADS] [CrossRef] [Google Scholar]
- Izquierdo-Villalba, D., Sesana, A., Bonoli, S., & Colpi, M. 2022, MNRAS, 509, 3488 [Google Scholar]
- Izquierdo-Villalba, D., Colpi, M., Volonteri, M., et al. 2023, A&A, 677, A123 [NASA ADS] [CrossRef] [EDP Sciences] [Google Scholar]
- Izquierdo-Villalba, D., Sesana, A., Colpi, M., et al. 2024, A&A, 686, A183 [NASA ADS] [CrossRef] [EDP Sciences] [Google Scholar]
- Kokorev, V., Caputi, K. I., Greene, J. E., et al. 2024, ApJ, 968, 38 [NASA ADS] [CrossRef] [Google Scholar]
- Kormendy, J., & Ho, L. C. 2013, ARA&A, 51, 511 [Google Scholar]
- Lacey, C., & Cole, S. 1993, MNRAS, 262, 627 [NASA ADS] [CrossRef] [Google Scholar]
- Lacy, M., Ridgway, S. E., Sajina, A., et al. 2015, ApJ, 802, 102 [NASA ADS] [CrossRef] [Google Scholar]
- Larson, R. B. 1998, MNRAS, 301, 569 [NASA ADS] [CrossRef] [Google Scholar]
- Latif, M. A., & Schleicher, D. R. G. 2015a, MNRAS, 449, 77 [NASA ADS] [CrossRef] [Google Scholar]
- Latif, M. A., & Schleicher, D. R. G. 2015b, A&A, 578, A118 [NASA ADS] [CrossRef] [EDP Sciences] [Google Scholar]
- Lauer, T. R., Tremaine, S., Richstone, D., & Faber, S. M. 2007, ApJ, 670, 249 [NASA ADS] [CrossRef] [Google Scholar]
- Liepold, E. R., & Ma, C.-P. 2024, ApJ, 971, L29 [Google Scholar]
- Liu, B., & Bromm, V. 2020, MNRAS, 495, 2475 [NASA ADS] [CrossRef] [Google Scholar]
- Lodato, G., & Natarajan, P. 2006, MNRAS, 371, 1813 [NASA ADS] [CrossRef] [Google Scholar]
- Luo, Y., Shlosman, I., Nagamine, K., & Fang, T. 2020, MNRAS, 492, 4917 [NASA ADS] [CrossRef] [Google Scholar]
- Lupi, A., Colpi, M., Devecchi, B., Galanti, G., & Volonteri, M. 2014, MNRAS, 442, 3616 [NASA ADS] [CrossRef] [Google Scholar]
- Lupi, A., Haardt, F., Dotti, M., & Colpi, M. 2015, MNRAS, 453, 3437 [Google Scholar]
- Lupi, A., Quadri, G., Volonteri, M., Colpi, M., & Regan, J. A. 2024, A&A, 686, A256 [NASA ADS] [CrossRef] [EDP Sciences] [Google Scholar]
- Ma, L., Hopkins, P. F., Ma, X., et al. 2021, MNRAS, 508, 1973 [NASA ADS] [CrossRef] [Google Scholar]
- Madau, P., & Rees, M. J. 2001, ApJ, 551, L27 [Google Scholar]
- Madau, P., Haardt, F., & Dotti, M. 2014, ApJ, 784, L38 [NASA ADS] [CrossRef] [Google Scholar]
- Maiolino, R., Scholtz, J., Curtis-Lake, E., et al. 2024, A&A, 691, A145 [NASA ADS] [CrossRef] [EDP Sciences] [Google Scholar]
- Marconi, A., Risaliti, G., Gilli, R., et al. 2004, MNRAS, 351, 169 [Google Scholar]
- Matthee, J., Naidu, R. P., Brammer, G., et al. 2024, ApJ, 963, 129 [NASA ADS] [CrossRef] [Google Scholar]
- Mayer, L., & Bonoli, S. 2019, Rep. Progr. Phys., 82, 016901 [CrossRef] [Google Scholar]
- Mehta, D., Regan, J. A., & Prole, L. 2024, Open J. Astrophys., 7, 107 [Google Scholar]
- Mo, H., van den Bosch, F. C., & White, S. 2010, Galaxy Formation and Evolution (Cambridge University Press) [Google Scholar]
- Pezzulli, E., Valiante, R., Orofino, M. C., et al. 2017, MNRAS, 466, 2131 [NASA ADS] [CrossRef] [Google Scholar]
- Pfister, H., Volonteri, M., Dubois, Y., Dotti, M., & Colpi, M. 2019, MNRAS, 486, 101 [Google Scholar]
- Planck Collaboration XVI. 2014, A&A, 571, A16 [NASA ADS] [CrossRef] [EDP Sciences] [Google Scholar]
- Rantala, A., Naab, T., & Lahén, N. 2024, MNRAS, 531, 3770 [NASA ADS] [CrossRef] [Google Scholar]
- Reardon, D. J., Zic, A., Shannon, R. M., et al. 2023, ApJ, 951, L6 [NASA ADS] [CrossRef] [Google Scholar]
- Regan, J. A., Johansson, P. H., & Wise, J. H. 2014, ApJ, 795, 137 [NASA ADS] [CrossRef] [Google Scholar]
- Regan, J. A., Wise, J. H., Woods, T. E., et al. 2020, Open J. Astrophys., 3, 15 [NASA ADS] [Google Scholar]
- Reines, A. E., & Volonteri, M. 2015, ApJ, 813, 82 [NASA ADS] [CrossRef] [Google Scholar]
- Reinoso, B., Schleicher, D. R. G., Fellhauer, M., Klessen, R. S., & Boekholt, T. C. N. 2018, A&A, 614, A14 [NASA ADS] [CrossRef] [EDP Sciences] [Google Scholar]
- Santamaría, L., Ohme, F., Ajith, P., et al. 2010, Phys. Rev. D, 82, 064016 [CrossRef] [Google Scholar]
- Sassano, F., Schneider, R., Valiante, R., et al. 2021, MNRAS, 506, 613 [CrossRef] [Google Scholar]
- Savorgnan, G. A. D., Graham, A. W., Marconi, A. r., & Sani, E. 2016, ApJ, 817, 21 [NASA ADS] [CrossRef] [Google Scholar]
- Schaerer, D. 2002, A&A, 382, 28 [NASA ADS] [CrossRef] [EDP Sciences] [Google Scholar]
- Schmidt, M. 1963, Nature, 197, 1040 [Google Scholar]
- Schneider, R., Ferrara, A., Natarajan, P., & Omukai, K. 2002, ApJ, 571, 30 [CrossRef] [Google Scholar]
- Schneider, R., Omukai, K., Inoue, A. K., & Ferrara, A. 2006, MNRAS, 369, 1437 [NASA ADS] [CrossRef] [Google Scholar]
- Sesana, A., & Khan, F. M. 2015, MNRAS, 454, L66 [Google Scholar]
- Shang, C., Bryan, G. L., & Haiman, Z. 2010, MNRAS, 402, 1249 [NASA ADS] [CrossRef] [Google Scholar]
- Shankar, F., Weinberg, D. H., & Miralda-Escudé, J. 2013, MNRAS, 428, 421 [NASA ADS] [CrossRef] [Google Scholar]
- Shen, X., Hopkins, P. F., Faucher-Giguère, C.-A., et al. 2020, MNRAS, 495, 3252 [Google Scholar]
- Shi, C., Wise, J., Xu, H., Norman, M. L., & O’Shea, B. W. 2015, Am. Astron. Soc. Meet. Abstr., 225, 347.12 [Google Scholar]
- Shi, Y., Kremer, K., & Hopkins, P. F. 2024, A&A, 691, A24 [NASA ADS] [CrossRef] [EDP Sciences] [Google Scholar]
- Smith, B. D., Regan, J. A., Downes, T. P., et al. 2018, MNRAS, 480, 3762 [NASA ADS] [CrossRef] [Google Scholar]
- Soltan, A. 1982, MNRAS, 200, 115 [Google Scholar]
- Spinoso, D., Bonoli, S., Valiante, R., Schneider, R., & Izquierdo-Villalba, D. 2023, MNRAS, 518, 4672 [Google Scholar]
- Springel, V. 2005, MNRAS, 364, 1105 [Google Scholar]
- Springel, V., White, S. D. M., Tormen, G., & Kauffmann, G. 2001, MNRAS, 328, 726 [Google Scholar]
- Suh, H., Civano, F., Trakhtenbrot, B., et al. 2020, ApJ, 889, 32 [NASA ADS] [CrossRef] [Google Scholar]
- Tamburello, V., Capelo, P. R., Mayer, L., Bellovary, J. M., & Wadsley, J. W. 2017, MNRAS, 464, 2952 [CrossRef] [Google Scholar]
- Tanaka, T., & Haiman, Z. 2009, ApJ, 696, 1798 [NASA ADS] [CrossRef] [Google Scholar]
- Trebitsch, M., Dubois, Y., Volonteri, M., et al. 2021, A&A, 653, A154 [NASA ADS] [CrossRef] [EDP Sciences] [Google Scholar]
- Tremmel, M., Karcher, M., Governato, F., et al. 2017, MNRAS, 470, 1121 [NASA ADS] [CrossRef] [Google Scholar]
- Valiante, R., Agarwal, B., Habouzit, M., & Pezzulli, E. 2017, PASA, 34, e031 [Google Scholar]
- Valiante, R., Colpi, M., Schneider, R., et al. 2021, MNRAS, 500, 4095 [Google Scholar]
- Visbal, E., Haiman, Z., & Bryan, G. L. 2014, MNRAS, 442, L100 [Google Scholar]
- Volonteri, M. 2010, A&ARv, 18, 279 [Google Scholar]
- Volonteri, M., Pfister, H., Beckmann, R. S., et al. 2020, MNRAS, 498, 2219 [Google Scholar]
- Whalen, D. J., & Fryer, C. L. 2012, ApJ, 756, L19 [NASA ADS] [CrossRef] [Google Scholar]
- White, S. D. M., & Frenk, C. S. 1991, ApJ, 379, 52 [Google Scholar]
- White, S. D. M., & Rees, M. J. 1978, MNRAS, 183, 341 [Google Scholar]
- Wu, X.-B., Wang, F., Fan, X., et al. 2015, Nature, 518, 512 [Google Scholar]
- Yang, J., Wang, F., Fan, X., et al. 2020, ApJ, 897, L14 [Google Scholar]
- Yoshida, N., Abel, T., Hernquist, L., & Sugiyama, N. 2003, ApJ, 592, 645 [CrossRef] [Google Scholar]
Appendix A: The formation places of MBH seeds and their wandering times
The upper panel of Fig. A.1 shows the cumulative distribution of r0 for PopIII remnants at different redshifts. At z > 15 (7) around 50% of the seed population is placed at > 100 (300) pc from the galactic centre. This redshift evolution is just the natural result of haloes being more extended towards lower redshift. As a result, the r0 value of an MBH seed formed at low-z will be extracted from a wider range of distances than a seed born at higher redshifts.
To show the typical time spent by MBH seeds in the wandering phase, the lower panel of Fig. A.1 shows the cumulative distribution function of  . As shown, 50% (20%) of the newly formed MBH seeds at z > 15 is expected to undergo a wandering phase that lasts > 2 Gyr (< 100 Myr). At lower redshifts, the duration of this phase increases. For example, 50% (20%) of the seeds formed at z ∼ 7 will wander for > 4 Gyr (< 400 Myr).
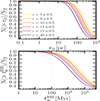 |
Fig. A.1. Cumulative distribution function of the initial position (r0, upper panel) and wandering time ( |

All Figures
|
Fig. 1. Redshift evolution of the number density of newly formed seeds predicted by L-GalaxiesBH when run on top of the Millennium-II merger trees. Red, blue, and green lines correspond to PopIII remnants, RSM, and DCBH seeds, respectively. |
| In the text | |
|
Fig. 2. Upper panels: Black hole mass function (BHMF) at z = 0, 1, 2, 3, 4, 5, 6, and 7. The results correspond to the L-GalaxiesBH SAM run on the Millennium merger trees after applying the grafting methodology presented in Section 2.2. The z = 0 observations correspond to Shankar et al. (2013), Shen et al. (2020), and Liepold & Ma (2024). Blue and orange lines represent the Fiducial and Off-center model predictions, respectively. Shaded areas show the Poisson error. Lower panels: Ratio between the predictions of the Off-center and Fiducial models. The horizontal grey lines are placed at 1, 2, and 5. |
| In the text | |
|
Fig. 3. Upper panels: Quasar luminosity function at z = 0.5, 2, 3, 5, 6, and 7 predicted by the Fiducial (blue) and Off-center (orange) models. The results of L-GalaxiesBH are presented for the Millennium trees with the grafting methodology. Shaded areas show the Poisson error. Observational data correspond to Shen et al. (2020), Lacy et al. (2015), Kokorev et al. (2024), Greene et al. (2024), Matthee et al. (2024), Akins et al. (2025), and Barlow-Hall & Aird (2025). Lower panels: Ratio between the predictions of the Off-center and Fiducial models. The horizontal grey lines are placed at 0.5, 1, 2, and 5 to guide the eye. Upper panels: Quasar luminosity function at z = 0.5, 2, 3, 5, 6, and 7 predicted by the Fiducial (blue) and Off-center (orange) models. The results of L-GalaxiesBH are presented for the Millennium trees with the grafting methodology. Shaded areas show the Poisson error. Observational data correspond to Shen et al. (2020), Lacy et al. (2015), Kokorev et al. (2024), Greene et al. (2024), Matthee et al. (2024), Akins et al. (2025), and Barlow-Hall & Aird (2025). Lower panels: Ratio between the predictions of the Off-center and Fiducial models. The horizontal grey lines are placed at 0.5, 1, 2, and 5 to guide the eye. |
| In the text | |
|
Fig. 4. Scaling relations at predicted by L-GalaxiesBH applied in the Millennium trees with the grafting methodology. Left panel: Median black hole mass (MBH) at fixed stellar mass (MStellar). The shaded areas correspond to the 16th–84th percentiles. Blue colours represent the results for the Fiducial model while orange corresponds to the Off-center model. Central and right panels: MBH − MStellar plane for MBHs with Lbol > 1044 erg/s. These populations extend far beyond the 16th–84th percentiles. The observational constraints are: at z = 0, from Erwin & Gadotti 2012 (squares) Reines & Volonteri 2015 (diamonds), and Capuzzo-Dolcetta & Tosta e Melo 2017 (circles); at z = 2, from Suh et al. 2020 (pentagons); and at z ≥ 5, from Maiolino et al. 2024 (circles), Harikane et al. 2023 (squares), and Ding et al. 2023 (stars). |
| In the text | |
|
Fig. 5. Fraction of mass acquired by the MBH via gas accretion. The left panels represent the entire MBH population divided in mass bins, while the right panel is restricted to active MBHs divided in different bolometric luminosities. Orange and blue lines represent the results for the Fiducial and Off-center models, respectively. Shaded areas correspond to the 16th–84th percentiles of the distribution. |
| In the text | |
|
Fig. 6. Redshift evolution of the percentage of MBHs that have grown at least a fraction 𝒢 of their initial seed mass. The upper and lower panels show the Fiducial and Off-center models, respectively. Different colours correspond to different 𝒢 values. |
| In the text | |
|
Fig. 7. Merger rate of MBHBs detected by LISA with S/N > 7. Each panel corresponds to merged binaries with different total mass (MBin). Blue lines show the predictions of the Fiducial model, while orange lines show those of the Off-center model. Pale lines represent the merger rates related to merging binaries with mass ratio q > 0.05 is assumed. The results were produced with L-GalaxiesBH applied in the Millennium-II simulation. The numbers inside each panel correspond to the integrated merger rate with all and mass-cut (q) MBHs in a given mass bin. |
| In the text | |
|
Fig. 8. Binary mass ratio, q, of merging MBHBs detected by LISA with S/N > 7. Each panel shows merged binaries with different total mass (MBin). Blue histograms represent the predictions of the Fiducial model and orange histograms represent those of the Off-center model. Horizontal dashed lines highlight the median value of the distribution. The results were produced using L-GalaxiesBH applied to the Millennium-II simulation. |
| In the text | |
|
Fig. A.1. Cumulative distribution function of the initial position (r0, upper panel) and wandering time ( |
| In the text | |
Current usage metrics show cumulative count of Article Views (full-text article views including HTML views, PDF and ePub downloads, according to the available data) and Abstracts Views on Vision4Press platform.
Data correspond to usage on the plateform after 2015. The current usage metrics is available 48-96 hours after online publication and is updated daily on week days.
Initial download of the metrics may take a while.