| Issue |
A&A
Volume 703, November 2025
|
|
|---|---|---|
| Article Number | A71 | |
| Number of page(s) | 5 | |
| Section | Interstellar and circumstellar matter | |
| DOI | https://doi.org/10.1051/0004-6361/202556933 | |
| Published online | 06 November 2025 | |
Line shapes of the Na/K resonance line profiles perturbed by H2 at extreme density
1
LIRA, Observatoire de Paris, Université PSL, Sorbonne Université, Sorbonne Paris Cité, CNRS,
61 Avenue de l'Observatoire,
75014
Paris,
France
2
Institut d’Astrophysique de Paris, UMR7095, CNRS, Université Paris VI,
98bis Boulevard Arago,
75014
Paris,
France
3
Department of Physics and Astronomy, University of Louisville,
Louisville,
Kentucky
40292,
USA
★ Corresponding author: This email address is being protected from spambots. You need JavaScript enabled to view it.
Received:
21
August
2025
Accepted:
1
October
2025
Abstract
Context. Collision broadening by molecular hydrogen of sodium and potassium is one of the major broadening mechanisms in the atmospheres of brown dwarf stars and exoplanets at an effective temperature of about 1000 K. The relevant H2 perturber densities reach several 1019 cm−3 in hot (Teff ≳ 1500 K) Jupiter-mass planets, and up to almost 1021 cm−3 (≈30 bar) for more massive or cooler objects. The Juno Microwave Radiometer has enabled observations of Jupiter’s atmosphere down to previously inaccessible depths where pressures near 106 bar have to be considered and the relevant H2 perturber densities may exceed 1025 cm−3.
Aims. While Na/K–He/H2 opacity tables have been constructed for the resonance lines that are valid to nH2 = 1021 cm−3, at higher density it is important to ensure accurate absorption cross-sections of these species in the models. We accurately determine the broadening of Na/K by H2 in the unified theory at H2 densities larger than 1021 cm−3 and compare to the corresponding Lorentzian profiles.
Methods. The theory of spectral line shapes, especially the unified approach we have developed, makes possible accurate models of stellar spectra that account both for the centers of spectral lines and their extreme wings in one consistent treatment. In this study, we examine the density dependence of the Na and K D2 (P3/2) components, respectively, at 5889.95 Å and 7664.90 Å from 1 × 10²¹ to 2 × 1022 cm−3.
Results. Lorentzian profiles from impact broadening theory are only valid in the core of the line not farther than a few half-widths as long as there is no overlap between the core of the line and possible quasi-molecular features in the wings due to close collisions.
Conclusions. The accurate computation of line profiles from collision broadening at high density requires use of a Fourier transform of the autocorrelation function inside the model atmosphere code. We strongly warn that use of Lorentzian profiles at a high perturber density neglects radiation during close collisions and may lead to erroneous conclusions.
Key words: line: profiles / planets and satellites: atmospheres / brown dwarfs
© The Authors 2025
 Open Access article, published by EDP Sciences, under the terms of the Creative Commons Attribution License (https://creativecommons.org/licenses/by/4.0), which permits unrestricted use, distribution, and reproduction in any medium, provided the original work is properly cited.
This article is published in open access under the Subscribe to Open model. This email address is being protected from spambots. You need JavaScript enabled to view it. to support open access publication.
1 Introduction
An understanding of how ambient molecules, atoms, ions, and electrons affect spectra of absorbing or emitting atoms is invaluable within many fields of science. Often termed pressure broadening, its accurate modeling with fundamental physics is possible with validation through laboratory experiments. It is often assumed that atomic spectral lines have Lorentzian profiles with width and shift proportional to the gas density. When that is the case, the resultant spectra are described by Voigt profiles for discrete transitions, and incorporation in stellar spectra models is computationally straightforward. However, we know from the underpinning physics that many spectral lines exhibit asymmetric profiles and diffuse “satellite” bands associated with atomic and molecular collisions that occur during the radiative process. While satellite bands were first reported in the late 1920s, their explanation evolved with improvements to the theory of spectral line formation and its dependence on the binary interactions of the emitter with its transient perturbers. The field has been summarized in a number of review articles (e.g., Margenau & Watson 1936; Ch’en & Takeo 1957; Allard & Kielkopf 1982). Given curated atomic and molecular data, astrophysicists use the results of these experimental and theoretical studies to aid them in determining the temperature, pressure and composition of planetary and stellar atmospheres. An example from our prior work is the appearance of Lyman α line satellites in synthetic spectra of DA white dwarf stars (e.g., Allard & Koester 1992). The purpose of this brief paper is to assist stellar and planetary astrophysicists with the implementation of state of the art line shape calculations in these applications.
As an illustration, consider why the unique optical spectra of L- and T-type low-mass and brown dwarf stars exhibit a depressed continuum from the visible through the near-infrared dominated by the far wings of the absorption profiles of the Na 3 s−3 p and K 4 s−4p doublets perturbed by molecular hydrogen and helium. The P1/2 (D1) line is due to a simple isolated A Π1/2 state, the line profile for the D1 line is totally asymmetric, whereas the P3/2 (D2) line comes from the A Π3/2 and B Σ1/2 adiabatic states arising from the 4p P3/2 atomic state. Blue satellite bands in alkali-He/H2 profiles are correlated with maxima in the excited B Σ1/2 state potentials and can be predicted from the maxima in the difference potentials ∆V for the B-X transition (Kielkopf et al. 2017). Our Na/K-He/H2 opacity tables of absorption coefficients were first implemented in Allard et al. (2003) in stellar model atmospheres and synthetic spectra by using the Allard et al. (2001) PHOENIX code. The results, compared to prior work lacking this fundamental spectral line theory, improved on quantitative interpretation of the observed spectra (Allard et al. 2003, 2007a). Subsequently, Tinetti et al. (2007) presented the first applications of profiles of Na and K perturbed by H2 to the modeling of structure and spectra of extra-solar planet atmospheres. Furthermore, it is known that the interiors of giant planets may contain deep radiative zones (Guillot et al. 1994; Siebenaler et al. 2025) that influence the transport of material from the interior to the atmosphere, requiring opacities valid at high density to model correctly. The deep structure that determines the internal processes and external emergent spectra may be evident in data from the Juno Microwave Radiometer that was designed to see deeper into Jupiter’s atmosphere than any previous instrument (Janssen et al. 2017; Aglyamov et al. 2025). Theoretical models of the interiors of giant planets depend on the properties of H2/He at pressures approaching 106 bar and temperatures of 5000 K (Stevenson 1982; Militzer & Hubbard 2024). For these applications to stellar and giant planet atmospheres, opacity tables were constructed allowing line profile models up to  over a wide range of temperatures to be obtained. It is at the highest densities that multiple-perturber effects have to be included because the line shapes are extremely non-Lorentzian. However, the tables also provide precise representation of the broadening, shift and developing asymmetry from the lowest densities contributing across the optical and infrared spectrum.
Similarly, Homeier et al. (2007) investigated these effects on the Na doublet observed in the spectra of metal-rich white dwarfs with a He-dominated atmosphere using opacities calculated from fundamental Na-He neutral atom interactions as input to spectral line shape theory. They found that cool white dwarfs show very strong Na absorption developing where the atomic helium density could reach beyond 1021 to 1022 cm−3. High helium density effects on the Na resonance line were presented in Fig. 7 of Allard et al. (2023) for He pressure up to 400 bar. Accurate profiles that are valid at such high densities of helium are required to be incorporated into white dwarf spectral models (Blouin et al. 2019).
The opacity in these cases cannot be represented analytically with a simple Lorentzian, Gaussian, or Voigt profile. Such often-used approaches are valid at low density if the width, shift and possible asymmetry parameters are calculated by accurate atomic physics, but the caveat is that is rarely done. Precise parameters are known only for limited pairs of atomic species such that a model with millions of atomic lines emitted by the whole range of atomic abundances, temperatures, and electron densities depends on estimates or ad hoc assumptions that are not comprehensively validated. When Doppler broadening due to high temperature, stellar rotation, and convection dominate the disk-integrated emergent spectrum, in practice this shortcoming can be inconsequential. However, in a high-density environment where the line strength of an abundant species is in a few spectral lines, the regions far from the line center develop as inner regions saturate. This leads to an opacity that can only be obtained by comprehensive line shape theory that itself depends on accurately determined atomic interactions. In our work, a unified line shape theory and a set of atomic interaction potential energies model the entire line profile from the impact-broadened line center to the far wing by using the Fourier transform (FT) of the spectral line shape autocorrelation function. This formalism, for which complete details and a derivation are given in Allard et al. (1999), encompasses a classical treatment of statistics and radiation with a quantum treatment of atomic structure and interactions. A briefer explanation of the theory was given in a recent paper (Allard et al. 2023). For the purposes of spectral synthesis for astrophysical applications it is necessary to understand in simple terms why this is necessary, how to properly implement the opacities from a mesh of tabular data when needed, and the shortcomings of using Lorentzian line shapes lacking validated parameters.
2 High density effects on the Na/K-H2 line profile
2.1 Spectral line absorption
There are various theoretical approaches for treating the problem of atomic lines broadened by collisions with atomic or molecular perturbers. Fully quantum-mechanical methods have been developed that allow practical calculations within the one-perturber approximation (Julienne & Mies 1986; Mies et al. 1986; Herman & Sando 1978; Sando & Herman 1983). The one-perturber approximation neglects the contribution of the core of the line, and is only valid in the wing and in the limit of densities low enough such that multiple-perturber effects may be neglected. An exact methodology for the quantum calculation at high densities, as encountered in stellar atmospheres or laboratory plasmas, is not known. Approximate unified-theory methods to construct density-dependent line shapes from one perturber spectra were developed in work by Fano (1963), Jablonski (1945, 1948), Anderson (1952), Baranger (1958c,b,a), and Szudy & Baylis (1975).
Our theoretical approach is based on the quantum theory of spectral line shapes of Baranger (1958c,b) in an adiabatic representation to include the degeneracy of atomic levels (Royer 1974, 1980; Allard et al. 1994). To evaluate an atomic spectral line shape, we computed a Fourier transform written formally as
 (1)
(1)
where s is time. The FT in Eq. (1) is taken such that I(∆ω) is normalized to unity when integrated over all frequencies, and ∆ω is the angular frequency difference measured relative to the unperturbed spectral line.
Here the correlation function Φ is not for a single isolated atom, but for an ensemble of sources each experiencing a different microscopic environment with a different temporal history during the radiative process. The well-developed theory of spectral line shapes allows us to compute the function
 (2)
(2)
in which the density of perturbers np is expressed explicitly, and the function 𝑔(s) depends only on single collisions.
The decay of the autocorrelation function Φ(s) with time leads to atomic line broadening. It depends on the density of perturbing atoms np and on their interaction with the radiating atom. Fundamentally we are able to calculate a spectrum in this way for any neutral atom given the temperature, density, and composition of the gas in which it is found. Moreover, the impact approximation determines the asymptotic behavior of the unified line shape correlation function. In this way the results described here are applicable to a more general line profile and opacity evaluation for the same perturbers at any given layer in the photosphere. This approach to calculating the spectral line profile requires knowledge of molecular potentials; that is, the binary interaction between an alkali atom and a perturbing atom as a function of their separation. We use the ab initio molecular-structure calculations reported in Allard et al. (2019) for the molecular potentials of Na-H2 system, and by Allard et al. (2016b) for the K-H2 system.
When np is high, the spectrum is evaluated by computing the FT of Eq. (2). The real part of np𝑔(s) damps Φ(s) for large s but this calculation is not feasible when extended wings have to be computed at low density because of the very slow decrease in the autocorrelation function. In the planetary and brown dwarf upper atmospheres the H2 density is of the order of 1016 cm−3 in the region of line core formation but the far wings play a crucial role for the continuum generated far from the line center. An alternative is to use the expansion of the spectrum I(∆ω) in powers of the density described in Royer (1971). For the implementation of alkali lines perturbed by helium and molecular hydrogen in atmosphere codes, the line opacity is calculated by splitting the profile into a core component described with a Lorentzian profile, and the line wings computed using an expansion of the autocorrelation function in powers of density. This use of the density expansion is described in Section 3.3 of Allard et al. (2019). Opacity tables of Na/K-He/H2that are the basis of line profiles for the D1 and D2 components are archived at the CDS (Allard et al. 2016b, 2019, 2023, 2024).
As a benchmark, the number density of a gas at 273.15 K and 100 kPa is Loschmidťs constant, exactly 2.651 645 804 × 1019 cm−3 (CODATA 2025). An atmosphere of pressure is 101.325 kPa, referred to as 1 bar. In laboratory experiments the density is increased largely by increasing pressure at approximately constant temperature, and consequently the increase in line widths is often referred to as pressure broadening. Line profile dependence on temperature enters through the relative kinetic energy of the perturbing atoms and the time dependence of binary collisions. The profile’s dependence on density results from the collision probability and, especially at higher densities, the increased likelihood of several perturbing atoms acting simultaneously. We see that at densities well below 1019 cm−3 typical line profiles in the core of the line are Lorentzian, but as the density rises above 1021 cm−3 the profiles become markedly non-Lorentzian, asymmetric, and may develop new components or “satellites” (Kielkopf & Allard 1979; Kielkopf 1983). Figure 1 shows H2 broadening of the D2 components of the resonance lines of Na and K for a H2 density  (370 bar) at 1000 K.
The cross section shown in Fig. 1 is determined from Eq. (1) and the oscillator strength of the transition. The normalization of the line shape calculated with a FT given in Eq. (1) connects to the absorption transition probability with the oscillator strength fij for the transition between two states of the emitter-perturber system as given in CGS units by (Hubeny & Mihalas 2015) (Eq. (5.105)) for the total line absorption cross section
 (3)
(3)
 (4)
(4)
 (5)
(5)
Bij is the Einstein coefficient for photon absorption. In the last equation we have the convenient substitution of the classical radius of the electron r0 = 2.818 × 10⁻¹³ cm. The frequency-integrated opacity per distance through an absorbing atomic number density na is then κ = naσ. The interpretation of this asymmetrical shape requires us to consider the conditions for the distinctive appearance of quasi-molecular features that are a consequence of radiative events during a close atomic collision.
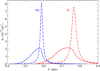 |
Fig. 1 Absorption cross section, σ, of the D2 component of the resonance lines of Na (blue curve) and K (red curve) perturbed by H2 collisions at T = 1000 K and |

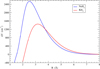 |
Fig. 2 ΔV(R) for the transitions involved in the Na-H2 line satellite (blue curve) and K-H2 satellite (red curve). |
2.2 Study of the quasi-molecular satellites
One outcome of our unified approach is that we may evaluate the difference between the impact limit and the general unified profile, and establish with certainty the region of validity of an assumed Lorentzian profile. Moreover the impact approximation breaks down and is not applicable even to the line core when an additional asymmetry is observed.
The unified profile shown in Fig. 1 is the FT of the autocorrelation function given by Eq. (2). In radiative collision transitions it is the difference between the final and initial state potential energies that determines the frequency and the energy of a single photon emitted or absorbed by the interacting atoms. The unified theory (Anderson 1952; Allard 1978) predicts that there will be line satellites centered periodically at frequencies corresponding to the extrema of the difference potential between the upper and lower states. In Allard & Biraud (1980) we have studied the profiles of spectral lines of alkalies perturbed by rare gases with a square-well potential, chosen for its simplicity in order to understand the influence of potential parameters on the profiles. Blue satellite bands in the resonance lines of Na/K-H2 profiles can be predicted from the maxima in the difference potentials ΔV for the B-X transition (Fig. 2). For clarity we only show ΔV for the symmetry C2υ. Figure 8 of Allard et al. (2007b) shows ΔV for other symmetries that are all of the same order. The difference potential maxima ΔVmax are, respectively, 2500 cm−1 for Na−H2 and 1500 cm−1 for K-H2. The line satellite positions depend on the value of the extrema of the potential difference ΔV(R), but they are always closer to the line center than this value. Line shape shows a strong density dependence: increasing the H2 density results in a shift of the whole profile toward the position of the satellite feature (Fig. 3). It is already the case when the H2 density reaches 1.2 × 1022 cm−3 for the K resonance line whereas the corresponding Lorentzian profiles remains at the same position. In this illustration, σ is a function of perturber density np, temperature T, and the frequency difference (here in cm−1), from the unperturbed spectral line center. Figure 3 shows that the line profiles of the Na/K resonance lines have orders of magnitude more absorption in the wing than a Lorentzian. The effect of this is increasingly important with increasing H2 density. As a result, the line profiles shift toward the position of the satellite band. There is a similar dependence on He density for the Na/K resonance lines (Allard et al. 2023, 2024). Lorentzian profiles used in Siebenaler et al. (2025) to compute opacity tables until 105 bar with large cutoffs are inadequate, since in that case Lorentzian profiles are not valid, even in the line core.
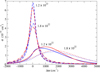 |
Fig. 3 Absorption cross section, σ, of the D2 component of the resonance lines of Na (blue curves ) and K (red curves) perturbed by H2 collisions at T = 1000 K for |

2.3 Density range of validity of a Lorentzian profile
Figure 1 clearly shows the asymmetrical shape of the very broad lines arising when the H2 density reaches 1022 cm−3. While most apparent at this extreme, it is already present at lower density for excited states. Generally, the higher the degree of excitation the more this is the case, as has been illustrated by laboratory experiments that confirm the theory (Kielkopf 1983). We conclude that the impact approximation breaks down and is not applicable to calculate the line core when an additional asymmetry is observed due to the presence of a close line satellite into the core of the line profile, even at low pressure, as in Fig. 13 of Allard et al. (2016a) for the 3p − 4s transition of Mg-He and as in Fig. 6 of Allard et al. (2012) for the 3p−4s transitions of Na perturbed by H2. Table 1 of the impact line parameters of Na−H2 for the 3p − 4s transition of Allard et al. (2012) and of K−H2 for the 4p − 5s transition in de Regt et al. (2025) are valid only at densities below 1019 cm−3 (0.3 bar).
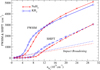 |
Fig. 4 The full width at half maximum (solid line) and shift (dashed line) of the Na (red) and K (blue) D2 spectral lines as a function of H2 density. The impact approximation FWHM (dotted line) shown for comparison is invalid for all but the lowest densities. |
3 Conclusions
The H2 density range shown here probes the prominent quasi-molecular features of the Na and K D2 components, respectively at 5889.95 Å and 7664.90 Å. The impact approximation breaks down at a density limit that is not necessarily very high. The disagreement with a Lorentzian profile depends on the value of ΔVmax in Fig. 2 responsible of the appearance of quasi-molecular features. The width, shift, and asymmetry of the lines are then very dependent on the nature of the interactions between the atoms at short and intermediate distance when the perturber density is higher.
We see that the profiles and parameters of the resonance lines of Na/K perturbed by H2 are thus very sensitive to H2 density. For an H2 density of 3 × 1021 cm−3, the full width at half maximum (FWHM) of the resonance lines of Na/K is larger than the impact approximation Lorentzian width (Fig. 4). This is not a unique case, but one that clearly illustrates how non-linear the non-Lorentzian shapes can become outside the limited range of validity of the impact approximation usually used in stellar and planetary atmosphere modeling. We have investigated high H2 broadened opacities of the doublets of the resonance lines of Na and K and shown that we have to reject Lorentzian approximations with unphysical values of a cut-off. The use of the Lorentzian approximation with the line parameters of Allard et al. (2019, 2016b) to calculate opacity tables at high pressures up to 105 bar for the Na/K−H2 systems in Siebenaler et al. (2025) may lead to erroneous conclusions.
Data availability
In Allard et al. (2016b), only the red part of the line wing of the D1 component was published online in CDS1.
Complete K−H2 opacity tables for the D1 and D2 components of the resonance line are available at the CDS via https://cdsarc.cds.unistra.fr/viz-bin/cat/J/A+A/703/A71
On the other hand, online Ariel data in GitHub (Chubb et al. 2024) contains a list of opacities and other data relevant for exoplanet atmospheres (https://github.com/Ariel-data). The ExoMolOP opacity database from (Chubb et al. 2021) is on the ExoMol opacity website (https://exomol.com/data/data-types/opacity).
Acknowledgements
We thank the referee for valuable comments that helped improve the manuscript. This work was supported by CNES, as part of the French contribution to the Ariel Space Mission. N.F. Allard is grateful to Gabriel-Dominique Marleau to point her the need to consider high density calculations of the Na/K resonance line profiles perturbed by H2 and Pierre Drossart to useful discussions and encouragments to do this work.
References
- Aglyamov, Y. S., Atreya, S. K., Bhattacharya, A., et al. 2025, Icarus, 425, 116334 [NASA ADS] [CrossRef] [Google Scholar]
- Allard, N. F. 1978, J. Phys. B: At. Mol. Opt. Phys., 11, 1383 [NASA ADS] [CrossRef] [Google Scholar]
- Allard, N. F., & Biraud, Y. G. 1980, J. Quant. Spectros. Radiat. Transfer., 23, 253 [Google Scholar]
- Allard, N. F., & Kielkopf, J. F. 1982, Rev. Mod. Phys., 54, 1103 [Google Scholar]
- Allard, N. F., & Koester, D. 1992, A&A, 258, 464 [NASA ADS] [Google Scholar]
- Allard, N. F., Koester, D., Feautrier, N., & Spielfiedel, A. 1994, A&AS, 108, 417 [NASA ADS] [Google Scholar]
- Allard, N. F., Royer, A., Kielkopf, J. F., & Feautrier, N. 1999, Phys. Rev. A, 60, 1021 [Google Scholar]
- Allard, F., Hauschildt, P. H., Alexander, D. R., Tamanai, A., & A. Schweitzer. 2001, ApJ, 556, 357 [NASA ADS] [CrossRef] [Google Scholar]
- Allard, N. F., Allard, F., Hauschildt, P. H., Kielkopf, J. F., & Machin, L. 2003, A&A, 411, L473 [NASA ADS] [CrossRef] [EDP Sciences] [Google Scholar]
- Allard, F., Allard, N. F., Homeier, D., et al. 2007a, A&A, 474, L21 [NASA ADS] [CrossRef] [EDP Sciences] [Google Scholar]
- Allard, N. F., Spiegelman, F., & Kielkopf, J. F. 2007b, A&A, 465, 1085 [NASA ADS] [CrossRef] [EDP Sciences] [Google Scholar]
- Allard, N. F., Spiegelman, F., Kielkopf, J. F., Tinetti, G., & Beaulieu, J. P. 2012, A&A, 543, A159 [NASA ADS] [CrossRef] [EDP Sciences] [Google Scholar]
- Allard, N. F., Leininger, T., Gadéa, F. X., Brousseau-Couture, V., & Dufour, P. 2016a, A&A, 588, A142 [NASA ADS] [CrossRef] [EDP Sciences] [Google Scholar]
- Allard, N. F., Spiegelman, F., & Kielkopf, J. F. 2016b, A&A, 589, A21 [NASA ADS] [CrossRef] [EDP Sciences] [Google Scholar]
- Allard, N. F., Spiegelman, F., Leininger, T., & Molliere, P. 2019, A&A, 628, A120 [NASA ADS] [CrossRef] [EDP Sciences] [Google Scholar]
- Allard, N. F., Myneni, K., Blakely, J. N., & Guillon, G. 2023, A&A, 674, A171 [NASA ADS] [CrossRef] [EDP Sciences] [Google Scholar]
- Allard, N. F., Kielkopf, J. F., Myneni, K., & Blakely, J. N. 2024, A&A, 683, A188 [NASA ADS] [CrossRef] [EDP Sciences] [Google Scholar]
- Anderson, P. W. 1952, Phys. Rev., 86, 809 [Google Scholar]
- Baranger, M. 1958a, Phys. Rev., 112, 855 [NASA ADS] [CrossRef] [Google Scholar]
- Baranger, M. 1958b, Phys. Rev., 111, 494 [NASA ADS] [CrossRef] [Google Scholar]
- Baranger, M. 1958c, Phys. Rev., 111, 481 [NASA ADS] [CrossRef] [Google Scholar]
- Blouin, S., Dufour, P., Allard, N. F., et al. 2019, ApJ, 872, 188 [NASA ADS] [CrossRef] [Google Scholar]
- Ch’en, S. Y., & Takeo, M. 1957, Rev. Mod. Phys., 29, 20 [Google Scholar]
- Chubb, K. L., Rocchetto, M., Yurchenko, S. N., et al. 2021, A&A, 646, A21 [NASA ADS] [CrossRef] [EDP Sciences] [Google Scholar]
- Chubb, K. L., Robert, S., Sousa-Silva, C., et al. 2024, RAS Tech. Instrum., 3, 636 [Google Scholar]
- CODATA, N. 2025, Fundamental Physical Constants, https://physics.nist.gov/cgi-bin/cuu/Value?n8, accessed: 2025-05-31 [Google Scholar]
- de Regt, S., Snellen, I. A. G., Allard, N. F., et al. 2025, A&A, 696, A225 [NASA ADS] [CrossRef] [EDP Sciences] [Google Scholar]
- Fano, F. 1963, Phys. Rev., 131, 259 [NASA ADS] [CrossRef] [Google Scholar]
- Guillot, T., Gautier, D., Chabrier, G., & Mosser, B. 1994, Icarus, 112, 337 [NASA ADS] [CrossRef] [Google Scholar]
- Herman, P. S., & Sando, K. M. 1978, J. Chem. Phys., 68, 1152 [NASA ADS] [Google Scholar]
- Homeier, D., Allard, N., Johnas, C. M. S., Hauschildt, P. H., & Allard, F. 2007, in Astronomical Society of the Pacific Conference Series, 372, 15th European Workshop on White Dwarfs, eds. R. Napiwotzki, & M. R. Burleigh, 277 [Google Scholar]
- Hubeny, I., & Mihalas, D. 2015, Theory of Stellar Atmospheres. An Introduction to Astrophysical Non-equilibrium Quantitative Spectroscopic Analysis, Princeton Series in Astrophysics (Princeton and Oxford: Princeton University Press) [Google Scholar]
- Jablonski, A. 1945, Phys. Rev., 68, 78 [NASA ADS] [CrossRef] [Google Scholar]
- Jablonski, A. 1948, Phys. Rev., 73, 258 [NASA ADS] [CrossRef] [Google Scholar]
- Janssen, M. A., Oswald, J. E., Brown, S. T., et al. 2017, Space Sci. Rev., 213, 139 [Google Scholar]
- Julienne, P. S., & Mies, F. H. 1986, Phys. Rev. A, 34, 3792 [NASA ADS] [CrossRef] [Google Scholar]
- Kielkopf, J. 1983, J. Phys. B At. Mol. Phys., 16, 3149 [NASA ADS] [CrossRef] [Google Scholar]
- Kielkopf, J. F., & Allard, N. F. 1979, Phys. Rev. Lett., 43, 196 [NASA ADS] [CrossRef] [Google Scholar]
- Kielkopf, J. F., Allard, N. F., Alekseev, V. A., et al. 2017, J. Phys. Conf. Ser., 810, 012023 [NASA ADS] [CrossRef] [Google Scholar]
- Margenau, H., & Watson, W. 1936, Rev. Mod. Phys., 8, 22 [Google Scholar]
- Mies, F. H., Julienne, P. S., Band, Y. B., & Singer, S. J. 1986, J. Phys. B: At. Mol. Opt. Phys., 19, 3249 [NASA ADS] [CrossRef] [Google Scholar]
- Militzer, B., & Hubbard, W. B. 2024, Icarus, 411, 115955 [NASA ADS] [CrossRef] [Google Scholar]
- Royer, A. 1971, Phys. Rev. A, 3, 2044 [Google Scholar]
- Royer, A. 1974, Can. J. Phys., 52, 1816 [NASA ADS] [CrossRef] [Google Scholar]
- Royer, A. 1980, Phys. Rev. A, 22, 1625 [NASA ADS] [CrossRef] [Google Scholar]
- Sando, K. M., & Herman, P. S. 1983, in Spectral Line Shapes, 2 (New York: Walter de Gruyter), 497 [NASA ADS] [Google Scholar]
- Siebenaler, L., Miguel, Y., de Regt, S., & Guillot, T. 2025, A&A, 693, A308 [NASA ADS] [CrossRef] [EDP Sciences] [Google Scholar]
- Stevenson, D. J. 1982, Annu. Rev. Earth Planet. Sci., 10, 257 [CrossRef] [Google Scholar]
- Szudy, J., & Baylis, W. 1975, J. Quant. Spectrosc. Radiat. Transfer, 15, 641 [CrossRef] [Google Scholar]
- Tinetti, G., Vidal-Madjar, A., Liang, M.-C., et al. 2007, Nature, 448, 169 [NASA ADS] [CrossRef] [Google Scholar]
All Figures
|
Fig. 1 Absorption cross section, σ, of the D2 component of the resonance lines of Na (blue curve) and K (red curve) perturbed by H2 collisions at T = 1000 K and |
| In the text | |
|
Fig. 2 ΔV(R) for the transitions involved in the Na-H2 line satellite (blue curve) and K-H2 satellite (red curve). |
| In the text | |
|
Fig. 3 Absorption cross section, σ, of the D2 component of the resonance lines of Na (blue curves ) and K (red curves) perturbed by H2 collisions at T = 1000 K for |
| In the text | |
|
Fig. 4 The full width at half maximum (solid line) and shift (dashed line) of the Na (red) and K (blue) D2 spectral lines as a function of H2 density. The impact approximation FWHM (dotted line) shown for comparison is invalid for all but the lowest densities. |
| In the text | |
Current usage metrics show cumulative count of Article Views (full-text article views including HTML views, PDF and ePub downloads, according to the available data) and Abstracts Views on Vision4Press platform.
Data correspond to usage on the plateform after 2015. The current usage metrics is available 48-96 hours after online publication and is updated daily on week days.
Initial download of the metrics may take a while.