| Issue |
A&A
Volume 705, January 2026
|
|
|---|---|---|
| Article Number | A228 | |
| Number of page(s) | 4 | |
| Section | Stellar structure and evolution | |
| DOI | https://doi.org/10.1051/0004-6361/202557412 | |
| Published online | 20 January 2026 | |
SN Ia 2025bvm in the Seyfert galaxy NGC 4156: Early detection and follow-up observations
1
Sternberg Astronomical Institute, M.V. Lomonosov Moscow State University, Universitetsky pr. 13 Moscow 119234, Russia
2
Department of Physics, Faculty of Natural Sciences, University of Haifa Haifa 3498838, Israel
3
Haifa Research Center for Theoretical Physics and Astrophysics, University of Haifa Haifa 3498838, Israel
4
School of Physics and Astronomy and Wise observatory, Tel Aviv University Tel Aviv 6997801, Israel
★ Corresponding author: This email address is being protected from spambots. You need JavaScript enabled to view it.
Received:
25
September
2025
Accepted:
28
November
2025
Abstract
Aims. We investigated the photometric and spectroscopic evolution of SN Ia 2025bvm to perform a detailed classification and provide an independent distance estimate for the host galaxy NGC 4156.
Methods. We present UBVRI photometry for a period between days −16 and 80 relative to the B-band maximum. Six optical spectra were taken between days −3 and 28. We used different fitting methods to derive the basic photometric parameters. We determined the expansion velocities from the blueshift of the Si II absorption line and the equivalent widths of the interstellar Na I lines.
Results. SN 2015bvm exhibits a photometric evolution typical for Type Ia supernovae; the Δm15 parameter and the rise time are both close to their mean values. The rising part of the light curves shows no signs of excess flux. The color curves indicate a significant color excess of E(B − V)tot = 0.22 ± 0.04 mag. The interstellar Na I lines in the host galaxy are stronger than expected for this value of dust extinction. SN 2025bvm is notable for its high expansion velocity at maximum light and the presence of a plateau in the velocity temporal evolution. We estimate a distance modulus of μ = 34.84 ± 0.10 mag, consistent with the value derived from the host galaxy redshift.
Key words: supernovae: individual: SN Ia 2025bvm
© The Authors 2026
 Open Access article, published by EDP Sciences, under the terms of the Creative Commons Attribution License (https://creativecommons.org/licenses/by/4.0), which permits unrestricted use, distribution, and reproduction in any medium, provided the original work is properly cited.
This article is published in open access under the Subscribe to Open model. This email address is being protected from spambots. You need JavaScript enabled to view it. to support open access publication.
1. Introduction
Type Ia supernovae (SNe Ia) are widely used as standardizable candles for establishing a distance scale in the Universe and the determination of cosmological parameters; their luminosity is tightly correlated with the shape of their light curves (e.g., Phillips 1993; Riess et al. 1998; Perlmutter et al. 1999). SNe Ia may also provide independent distance estimates for their host galaxies (e.g., Vinkó et al. 2012). Despite the importance of SNe Ia, the nature of their progenitors and their explosion mechanism remain an active topic of discussion (see reviews by Jha et al. 2019; Ruiter 2019; Blondin 2024). Observations obtained during the early phases of evolution may provide important clues to these issues (e.g., Deckers et al. 2022).
SN 2025bvm (ATLAS25bqt, ZTF25aafwbhf) was discovered by the Asteroid Terrestrial-impact Last Alert System (ATLAS) (Tonry et al. 2018) on 2025-02-17.48 UT with an “orange” magnitude of 18.768. The transient was not detected on 2025-02-14.52 UT (Stevance et al. 2025). The Zwicky Transient Facility (ZTF) (Bellm et al. 2019) subsequently detected the object on 2025-02-18.43 UT with a g-ZTF magnitude of 18.551. The transient is located at  (J2000), with an offset of
  west and
  north from the center of NGC 4156, a Seyfert galaxy with redshift z = 0.022617 according to the NASA/IPAC Extragalactic Database (NED)2. NGC 4156 is located at
  from another Seyfert galaxy NGC 4151, which is much closer (z = 0.003326).
SN 2025bvm was classified as a type Ia supernova by Balcon (2025) and Fremling et al. (2025). Early spectroscopic observations on February 28 were reported by Casetti et al. (2025), who confirmed the classification and derived the expansion velocity at about 12 600 km s−1 from the Si II λ6355 line.
NGC 4156 is a spiral galaxy of type SB(rs)b. Its redshift relative to CMB, reported in NED, corresponds to a distance modulus μ = 34.95 ± 0.07, assuming H0 = 72 km s−1 Mpc−1.
Tozzi et al. (2022) reported on the changing-look nature of the active galactic nucleus (AGN) in the galaxy NGC 4156. Independent distance estimates to such objects are of great importance, as they provide essential constraints on the fundamental parameters of AGNs, including the black hole mass (see, e.g., Tsvetkov et al. 2019, 2021; Hönig et al. 2014).
2. Observations and data reduction
We detected SN 2025bvm 1.5 days before discovery in images obtained while observing the Seyfert galaxy NGC 4151. Follow-up photometric UBVRI CCD observations of SN 2025bvm were carried out at the facilities of the Sternberg Astronomical Institute (SAI): the 60 cm Ritchey-Chretien telescope of the Caucasus Mountain Observatory (CMO) of SAI (K60) (Berdnikov et al. 2020); the 60 cm Cassegrain reflector (C60) and the 60 cm Ritchey-Chretien telescope (CR60) of SAI Crimean Astronomical Station (CAS); and the 70 cm telescope of SAI Moscow Observatory (M70). BVR photometry was performed at the Wise Observatory with the 0.46 m Centurion 18 telescope (W18) (Brosch et al. 2008).
The standard image reductions were carried out with custom pipelines at each telescope. Subtraction of the galaxy background and photometry were performed using the IRAF3.
The magnitudes of SN 2025bvm were derived by a PSF fitting relative to a sequence of local standard stars near NGC 4151 (Tsvetkov et al. 2021). Spectroscopic observations were performed with the 2.5 m telescope of CMO SAI (Potanin et al. 2017), using a low-resolution double-beam spectrograph TDS (Potanin et al. 2020). We used a slit width of 1″; the dispersion was 1.21 and 0.87 Å/pix for the blue and red channels, respectively. To reduce the raw spectra, we used a Python-based data processing package, developed at SAI (see Potanin et al. 2020 for details).
3. Photometry
3.1. The light curves
The light curves of SN025bvm are presented in Fig. 1. We determined the photometric parameters using the SNooPy package (Burns et al. 2011). The rising and near-maximum parts of the BVR light curves were fitted by the expression proposed by Zheng et al. (2017).
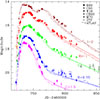 |
Fig. 1. Light curves of SN 2025bvm in the UBVRI bands. The gr magnitudes from ZTF and the o-band magnitude and upper limit from ATLAS are also plotted. The data in the different filters are shown in different colors and shifted vertically for better display. A comparison with the light curves of SNe Ia 2003du (solid lines) and 2011fe (dashed lines) is presented. |
The fits were used to determine the dates and magnitudes at maximum light in different passbands. The maximum in the B-band was reached on JD 2460738.4 ± 0.3 with B = 16.18 ± 0.02 mag. The time differences in days and magnitudes for the UVRI bands are respectively −1.8, 16.00 ± 0.03; +1.6, 16.06 ± 0.02; +1.7, 15.94 ± 0.02; and −2.8, 16.23 ± 0.04. We applied the SNooPy EBV_model2 to derive the decline-rate and color-stretch parameters; the results are Δm15 = 0.97 ± 0.06, sBV = 1.11 ± 0.05.
We compared the light curves of SN 2025bvm with those of SNe Ia 2003du (Stanishev et al. 2007) and 2011fe (Tsvetkov et al. 2013; Vinkó et al. 2012; Richmond & Smith 2012; Munari et al. 2013), which have similar values of the Δm15 parameter. The comparison reveals a similarity of the photometric evolution for these SNe; some differences may be noted for the I-band light curve of SN 2025bvm near maximum and on the final decline stage.
The rising parts of the light curves in the B, V, R bands are presented in Fig. 2. The expression from Zheng et al. (2017) is a good fit for the light curves; we do not detect any significant excess emission. The first light date is JD 2460720.8 ± 0.4, so the rise time in the B-band is 18.1 ± 0.5 days.
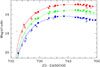 |
Fig. 2. Rising parts of the BVR light curves of SN 2025bvm and fitting with the expression from Zheng et al. (2017) (solid lines). The symbols are the same as in Fig. 1. We calculated the BVR magnitudes from the ZTF data using relations for the stars from Jester et al. (2005). |
3.2. The color curves and extinction
The color curves of SN 2025bvm are shown in Fig. 3. The comparison with those for SNe Ia 2003du and 2011fe shows that their shape is typical for type Ia SNe. SNe 2003du and 2011fe have negligible interstellar extinction, and the comparison reveals some color excess for SN 2025bvm, which is evident for the (B − V),(V − R) and (U − B) color curves, but is absent for the (R − I) color.
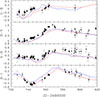 |
Fig. 3. Color curves of SN 2025bvm in comparison with those for SNe Ia 2003du (red line) and 2011fe (blue line). The symbols are the same as in Fig. 1. |
A number of methods for estimating the extinction from the (B − V) color curve were proposed; they are based on comparison of observed colors at different epochs with the intrinsic colors of reddening-free SNe. We corrected the observed colors for the Galactic extinction E(B − V)Gal = 0.022 mag (Schlafly & Finkbeiner 2011) and applied three methods to derive the host galaxy extinction. We compared the pseudocolor (Bmax − Vmax) and color (B − V)15 at 15 days after the B-band maximum with the reddening-free colors, calibrated by Wang et al. (2009b). The resuts are E(B − V)host = 0.18 ± 0.04 and 0.20 ± 0.10 mag, respectively. The Lira relation as presented by Contreras et al. (2018) yields E(B − V)host = 0.23 ± 0.08 mag. The weighted mean of the three estimates is E(B − V)host = 0.19 ± 0.04 mag.
We detected interstellar Na ID lines originating both in the Galaxy and in the host. The equivalent widths (EWs) of the Galactic lines D2, D1 are, respectively, 0.20 ± 0.06 and 0.13 ± 0.03 Å. The lines produced in the host galaxy are much stronger; the EWs are 1.38 ± 0.03 and 1.06 ± 0.08 Å.
The relations by Poznanski et al. (2012) imply a Galactic extinction of E(B − V)Gal = 0.034 mag, with an uncertainty of ±68% (Phillips et al. 2013), which is consistent with the value of E(B − V)Gal = 0.022 mag derived from the extinction map of Schlafly & Finkbeiner (2011). As shown by Phillips et al. (2013), the large EWs of the host galaxy lines cannot be used to provide a reliable estimate of the host extinction.
We applied the SNooPy EBV_model2, which assumes H0 = 72 km s−1 Mpc−1 to derive the host extinction and the distance modulus for SN 2015bvm, and obtained E(B − V)host = 0.21 ± 0.06 mag and μ = 34.90 ± 0.10 mag. The value of the host extinction is in good agreement with the result from the analysis of the (B − V) color curve, and we accept the mean value E(B − V)host = 0.20 ± 0.04, which is used hereafter.
The distance for SN 2025bvm may be determined using the relations between the decline-rate, color-stretch parameters and absolute magnitude for SNe Ia. The calibrations of these relations by Prieto et al. (2006), Burns et al. (2018), Ashall et al. (2020), which also assume H0 = 72 km s−1 Mpc−1, yield mean values MB = −19.46 ± 0.06 mag, MV = −19.40 ± 0.05 mag. Using the maximum magnitudes and extinction determined earlier and accepting RV = 3.1 we obtain μ = 34.77 ± 0.11 mag. This value is in satisfactory agreement with the result obtained by SNooPy, and the mean value μ = 34.84 ± 0.10 mag may be accepted as the most probable distance estimate based on SN 2025bvm photometric characteristics.
4. Spectra
The spectra of SN 2025bvm are shown in Fig. 4. The spectral evolution of SN 2025bvm is generally consistent with that for most of SNe Ia.
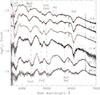 |
Fig. 4. Spectra of SN 2025bvm, corrected for extinction E(B − V)tot = 0.22 mag. The numbers near each spectrum indicate the epoch in days relative to the B-band maximum. The black lines – indicate the data; the red lines – are for the SYN++ models. |
We determined the EWs of the absorption minima near 6200 and 5800 Å; the former is identified with the Si II λ6355 line, while the latter is usually attributed to Si II λ5972 line, but may also be blended with the Na ID. The EWs of these absorptions in the near-maximum spectra are 91 ± 5 and 15±7 Å, respectively, which allow us to classify SN 2025bvm as belonging to the core normal (CN) group (Branch et al. 2006).
The expansion velocity evolution of the Si II λ6355 line is shown in Fig. 5. It is compared with the data for SNe 2003du, 2011fe, 2012fr, and 2021wuf (Stanishev et al. 2007; Pereira et al. 2013; Contreras et al. 2018; Zeng et al. 2024). Our data reveal that SN 2025bvm exhibits a high expansion velocity and a very low velocity gradient, which allow us to classify it as a high velocity (HV) and low velocity gradient (LVG) object (Benetti et al. 2005; Wang et al. 2009a).
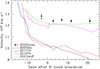 |
Fig. 5. Expansion velocity evolution for SN 2025bvm. The black dots show our data; the circle is the result from Casetti et al. (2025). These data are compared with the data for SNe 2003du, 2011fe, 2012fr, and 2021wuf (see legend for color-coding). |
Although the photometric characteristics of SNe 2003du and 2011fe are similar to those of SN 2025bvm, they have different expansion velocity evolutions. A nearly constant velocity for the period of about a month after maximum, as observed for SNe Ia 2012fr, 2021wuf, is a rare phenomenon (Contreras et al. 2018; Zeng et al. 2024).
We modeled the spectra of SN 2025bvm with the SYN++ code (Thomas et al. 2011); the results are presented in Fig. 4. We used a typical set of ions for SNe Ia for the first month of evolution: Si II, S II, Mg II, Ca II, Na I, Fe II, Fe III. The most prominent absorption minima are marked with dashed lines; the ions contributing to these minima are indicated. The main parameters of the models are the photosphere velocity and blackbody temperature. For the spectra at epoch −3 days the velocity is v = 14 × 103 km s−1 and the temperature is T = 15 × 103 K. The temperature drops to 12 × 103 K on days 3–7, 11 × 103 K on day 12 and to about 6 × 10³ K on days 21–28. The velocity remains nearly constant at v = 13 × 103 km s−1 for the whole period. The temperature evolution is similar to that found by Branch et al. (2005) for SN 1994D, while the velocity does not decrease with time, as observed for most SNe Ia.
5. Conclusions
The photometric evolution of SN 2025bvm is typical for SNe Ia; the parameter Δm15 = 0.97 is close to the mean value. This is confirmed by a comparison with the light curves of normal SNe Ia 2003du and 2011fe. The rising part of the BVR light curves is fitted by the equation from Zheng et al. (2017). We do not detect excess emission during the early stage of evolution.
The host galaxy dust extinction E(B − V)host determined from the color curves of SN 2025bvm is about 0.20 mag, but the strength of the interstellar Na I lines indicates much higher extinction. This problem was discussed by Phillips et al. (2013), who found that about one-quarter of SNe Ia display anomalously strong interstellar Na I lines and suggested that the outflowing circumstellar gas may be responsible for this effect.
The relative strength of the absorption features and the evolution of the ejecta velocity based of the blueshift of Si II λ6355 line allow us to classify SN 2025bvm as belonging to CN, HV, and LVG objects according to the scheme proposed by Benetti et al. (2005), Wang et al. (2009b), Branch et al. (2006).
The temporal evolution of the Si II λ6355 velocity for SN 2025bvm is peculiar and shows a similarity with that of SNe Ia 2012fr and 2021wuf. Contreras et al. (2018) reported more examples of this phenomenon, and pointed out that all such SNe Ia belong to CN class and exhibit a low rate of brightness decline. Zeng et al. (2024) assumed that this feature may be connected to density enhancement at a specific velocity in the ejecta. Contreras et al. (2018) further proposed that such objects may represent a subclass of SNe Ia.
The distance estimate obtained using the width-luminosity relation and SNooPy fitter μSN = 34.84 ± 0.10 mag, assuming H0 = 72 km s−1 Mpc−1, is in reasonable agreement with the value μz = 34.95 ± 0.07, derived from the redshift of the host galaxy using the same value of H0. The distance determined from the photometric properties of SN 2025bvm depends on RV. If it is lower than the standard value 3.1, as was found for many supernovae (e.g., Phillips et al. 2013), μSN would be larger, improving the agreement with μz.
Data availability
The data underlying this article are available in the Weizmann Interactive Supernova Data Repository (WISeREP) at https://www.wiserep.org/object/27554.
Acknowledgments
We thank the anonymous reviewer for comments that helped improve the paper. The work of D. Tsvetkov and V. Echeistov on data processing and analysis, spectra modeling was supported by the Russian Science Foundation grant No.24-12-00141. This work was carried out using equipment acquired through the Development Program of Lomonosov Moscow State University.
References
- Ashall, C., Lu, J., Burns, C., et al. 2020, ApJ, 895, L3 [NASA ADS] [CrossRef] [Google Scholar]
- Balcon, C. 2025, TNS Classif. Rep., 2025–729, 1 [Google Scholar]
- Bellm, E. C., Kulkarni, S. R., Barlow, T., et al. 2019, PASP, 131, 068003 [Google Scholar]
- Benetti, S., Cappellaro, E., Mazzali, P. A., et al. 2005, ApJ, 623, 1011 [NASA ADS] [CrossRef] [Google Scholar]
- Berdnikov, L. N., Belinskii, A. A., Shatskii, N. I., et al. 2020, Astron. Rep., 64, 310 [NASA ADS] [CrossRef] [Google Scholar]
- Blondin, S. 2024, ArXiv e-prints [arXiv:2411.09740] [Google Scholar]
- Branch, D., Baron, E., Hall, N., Melakayil, M., & Parrent, J. 2005, PASP, 117, 545 [NASA ADS] [CrossRef] [Google Scholar]
- Branch, D., Dang, L. C., Hall, N., et al. 2006, PASP, 118, 560 [NASA ADS] [CrossRef] [Google Scholar]
- Brosch, N., Polishook, D., Shporer, A., et al. 2008, Ap&SS, 314, 163 [NASA ADS] [CrossRef] [Google Scholar]
- Burns, C. R., Stritzinger, M., Phillips, M. M., et al. 2011, AJ, 141, 19 [Google Scholar]
- Burns, C. R., Parent, E., Phillips, M. M., et al. 2018, ApJ, 869, 56 [Google Scholar]
- Casetti, L., Lusso, E., & Zanchettin, M. V. 2025, TNSAN, 75, 1 [Google Scholar]
- Contreras, C., Phillips, M. M., Burns, C. R., et al. 2018, ApJ, 859, 24 [NASA ADS] [CrossRef] [Google Scholar]
- Deckers, M., Maguire, K., Magee, M. R., et al. 2022, MNRAS, 512, 1317 [NASA ADS] [CrossRef] [Google Scholar]
- Fremling, C., Neill, D., & Sharma, Y. 2025, TNS Classif. Rep., 2025–805, 1 [Google Scholar]
- Hönig, S. F., Watson, D., Kishimoto, M., & Hjorth, J. 2014, Nature, 515, 528 [CrossRef] [Google Scholar]
- Jester, S., Schneider, D. P., Richards, G. T., et al. 2005, AJ, 130, 873 [Google Scholar]
- Jha, S. W., Maguire, K., & Sullivan, M. 2019, Nat. Astron., 3, 706 [NASA ADS] [CrossRef] [Google Scholar]
- Munari, U., Henden, A., Belligoli, R., et al. 2013, New Astron., 20, 30 [Google Scholar]
- Pereira, R., Thomas, R. C., Aldering, G., et al. 2013, A&A, 554, A27 [NASA ADS] [CrossRef] [EDP Sciences] [Google Scholar]
- Perlmutter, S., Aldering, G., Goldhaber, G., et al. 1999, ApJ, 517, 565 [Google Scholar]
- Phillips, M. M. 1993, ApJ, 413, L105 [Google Scholar]
- Phillips, M. M., Simon, J. D., Morrell, N., et al. 2013, ApJ, 779, 38 [NASA ADS] [CrossRef] [Google Scholar]
- Potanin, S. A., Gorbunov, I. A., Dodin, A. V., et al. 2017, Astron. Rep., 61, 715 [Google Scholar]
- Potanin, S. A., Belinski, A. A., Dodin, A. V., et al. 2020, Astron. Lett., 46, 836 [NASA ADS] [CrossRef] [Google Scholar]
- Poznanski, D., Prochaska, J. X., & Bloom, J. S. 2012, MNRAS, 426, 1465 [Google Scholar]
- Prieto, J. L., Rest, A., & Suntzeff, N. B. 2006, ApJ, 647, 501 [NASA ADS] [CrossRef] [Google Scholar]
- Richmond, M. W., & Smith, H. A. 2012, JAAVSO, 40, 872 [Google Scholar]
- Riess, A. G., Filippenko, A. V., Challis, P., et al. 1998, AJ, 116, 1009 [Google Scholar]
- Ruiter, A. 2019, Supernova Remnants: An Odyssey in Space after Stellar Death II, 71 [Google Scholar]
- Schlafly, E. F., & Finkbeiner, D. P. 2011, ApJ, 737, 103 [Google Scholar]
- Stanishev, V., Goobar, A., Benetti, S., et al. 2007, A&A, 469, 645 [NASA ADS] [CrossRef] [EDP Sciences] [Google Scholar]
- Stevance, H., Smith, K. W., Young, D. R., et al. 2025, TNSAN, 60, 1 [Google Scholar]
- Thomas, R. C., Nugent, P. E., & Meza, J. C. 2011, PASP, 123, 237 [NASA ADS] [CrossRef] [Google Scholar]
- Tonry, J. L., Denneau, L., Heinze, A. N., et al. 2018, PASP, 130, 064505 [Google Scholar]
- Tozzi, G., Lusso, E., Casetti, L., et al. 2022, A&A, 667, L12 [NASA ADS] [CrossRef] [EDP Sciences] [Google Scholar]
- Tsvetkov, D. Y., Shugarov, S. Y., Volkov, I. M., et al. 2013, CAOSP, 43, 94 [Google Scholar]
- Tsvetkov, D. Y., Baklanov, P. V., Potashov, M. S., et al. 2019, MNRAS, 487, 3001 [NASA ADS] [CrossRef] [Google Scholar]
- Tsvetkov, D. Y., Pavlyuk, N. N., Vozyakova, O. V., et al. 2021, Astron. Lett., 47, 291 [NASA ADS] [CrossRef] [Google Scholar]
- Vinkó, J., Sárneczky, K., Takáts, K., et al. 2012, A&A, 546, A12 [NASA ADS] [CrossRef] [EDP Sciences] [Google Scholar]
- Wang, X., Filippenko, A. V., Ganeshalingam, M., et al. 2009a, ApJ, 699, L139 [NASA ADS] [CrossRef] [Google Scholar]
- Wang, X., Li, W., Filippenko, A. V., et al. 2009b, ApJ, 697, 380 [NASA ADS] [CrossRef] [Google Scholar]
- Zeng, X., Li, S., Wang, X., et al. 2024, A&A, 691, A90 [NASA ADS] [CrossRef] [EDP Sciences] [Google Scholar]
- Zheng, W., Kelly, P. L., & Filippenko, A. V. 2017, ApJ, 848, 66 [NASA ADS] [CrossRef] [Google Scholar]
IRAF is distributed by the National Optical Astronomy Observatory, which is operated by AURA under cooperative agreement with the National Science Foundation.
All Figures
|
Fig. 1. Light curves of SN 2025bvm in the UBVRI bands. The gr magnitudes from ZTF and the o-band magnitude and upper limit from ATLAS are also plotted. The data in the different filters are shown in different colors and shifted vertically for better display. A comparison with the light curves of SNe Ia 2003du (solid lines) and 2011fe (dashed lines) is presented. |
| In the text | |
|
Fig. 2. Rising parts of the BVR light curves of SN 2025bvm and fitting with the expression from Zheng et al. (2017) (solid lines). The symbols are the same as in Fig. 1. We calculated the BVR magnitudes from the ZTF data using relations for the stars from Jester et al. (2005). |
| In the text | |
|
Fig. 3. Color curves of SN 2025bvm in comparison with those for SNe Ia 2003du (red line) and 2011fe (blue line). The symbols are the same as in Fig. 1. |
| In the text | |
|
Fig. 4. Spectra of SN 2025bvm, corrected for extinction E(B − V)tot = 0.22 mag. The numbers near each spectrum indicate the epoch in days relative to the B-band maximum. The black lines – indicate the data; the red lines – are for the SYN++ models. |
| In the text | |
|
Fig. 5. Expansion velocity evolution for SN 2025bvm. The black dots show our data; the circle is the result from Casetti et al. (2025). These data are compared with the data for SNe 2003du, 2011fe, 2012fr, and 2021wuf (see legend for color-coding). |
| In the text | |
Current usage metrics show cumulative count of Article Views (full-text article views including HTML views, PDF and ePub downloads, according to the available data) and Abstracts Views on Vision4Press platform.
Data correspond to usage on the plateform after 2015. The current usage metrics is available 48-96 hours after online publication and is updated daily on week days.
Initial download of the metrics may take a while.