| Issue |
A&A
Volume 706, February 2026
|
|
|---|---|---|
| Article Number | A59 | |
| Number of page(s) | 17 | |
| Section | Stellar structure and evolution | |
| DOI | https://doi.org/10.1051/0004-6361/202557446 | |
| Published online | 30 January 2026 | |
The lack of fast rotators in Cyg OB2
I. Insights from spectral reclassification of its B0 population
1
Instituto de Astrofísica de Canarias, c/ Vía Láctea s/n E-38205 La Laguna Tenerife, Spain
2
Departamento de Astrofísica, Universidad de La Laguna E-38206 La Laguna Tenerife, Spain
3
Gran Telescopio Canarias (GRANTECAN), c/ Cuesta de San José s/n E-38712 Breña Baja La Palma, Spain
★ Corresponding author: This email address is being protected from spambots. You need JavaScript enabled to view it.
Received:
26
September
2025
Accepted:
16
October
2025
Abstract
Context. Cygnus OB2, located within the Cygnus X complex – one of the most active star-forming regions of the Galaxy – hosts hundreds of O- and B-type stars at different evolutionary stages. This rich association offers a unique opportunity to study the evolution and dynamic interactions of massive stars. However, despite extensive studies, a notable absence of a fast-rotating group (v sin i > 200 km s−1) among the O-type population of Cygnus OB2 challenges current models of massive star evolution.
Aims. Stellar rotation strongly impacts spectral line shapes of O-type stars, with high rotational velocities potentially leading to misclassifications. This study investigates whether some stars in Cygnus OB2, classified at low spectral resolution as B0, are actually rapidly rotating late-O types. Such cases could explain the observed lack of fast rotators in Cygnus OB2.
Methods. Considering the effects of rotation, we reclassified the known B0 population in Cygnus OB2, using the MGB tool and both the new and pre-existing optical spectroscopy. Finally, we computed the projected rotational velocities using iacob-broad.
Results. We find that approximately 19% of the initial B0 population in Cygnus OB2 are, in fact, late-O types. Further analysis shows that only six stars in the entire dataset have projected rotational velocities above 200 km s−1, with just one new O-type star exceeding this threshold.
Conclusions. In our study of Cygnus OB2, we continue to find a notable lack of fast rotators among its O-type population. We propose a combination of three factors as the most likely explanation: (i) the young age of Cygnus OB2 may imply that fast rotators have not been produced yet due to binary interactions; (ii) fast rotators may have been dynamically ejected from the core as runaway stars; and (iii) local star formation conditions may hinder binary formation (reducing spin-up interactions) or result in slower rotational velocities at birth.
Key words: techniques: spectroscopic / stars: early-type / stars: massive / stars: rotation / open clusters and associations: individual: Cygnus OB2
© The Authors 2026
 Open Access article, published by EDP Sciences, under the terms of the Creative Commons Attribution License (https://creativecommons.org/licenses/by/4.0), which permits unrestricted use, distribution, and reproduction in any medium, provided the original work is properly cited.
This article is published in open access under the Subscribe to Open model. This email address is being protected from spambots. You need JavaScript enabled to view it. to support open access publication.
1. Introduction
Hot massive stars play a crucial role in the large-scale evolution of the cosmos. Throughout their complex life cycles, these stars are associated with the most powerful and luminous phenomena in the Universe (Langer 2012). These events significantly affect their surroundings and host galaxies through mechanical and radiative feedback (Oey & Clarke 2009; Geen et al. 2015; Rebolledo et al. 2020).
Traditionally, stellar masses and metallicity have been considered the key parameters that determine stellar formation, structure, and evolution. However, the role of rotation has become a critical factor, particularly in the evolution of massive stars at low metallicities (Maeder & Meynet 2000). Given its importance, several studies have investigated the rotational properties of O-type stars, revealing a consistent bimodal distribution. This pattern, initially noted by Conti & Ebbets (1977) and confirmed in various studies of galactic (Penny 1996; Holgado et al. 2022) and extragalactic (Ramírez-Agudelo et al. 2013, 2015) O stars, indicates that most of these stars (approximately 50 − 70% of the total population) present slow rotation, ranging from 40 − 80 km s−1. Moreover, in the Galaxy, the tail of fast rotators is dominated by apparently single stars with masses < 32 M⊙, extending from ∼200 up to 400 km s−1 (Holgado et al. 2022). Extragalactic studies reveal a similar pattern, with the high-velocity tail preferentially populated by low-mass O stars (Ramírez-Agudelo et al. 2013).
This wide range of rotational velocities observed in massive stars cannot be fully explained by current single stellar models or by simply assuming a broad range of initial spin rates at birth (but see Nazé et al. 2024, for an alternative perspective). Certain features in these distributions suggest that some stars undergo spin-up processes during their evolution. The most widely accepted explanation for the bimodality in O-type rotational velocities is the effect and/or influence of binary interactions:
-
Given the high intrinsic multiplicity of massive stars (Mason et al. 2009; Sana et al. 2014), many are expected to interact with a companion during their lifetime (Sana et al. 2012).
-
For stars with masses below 32 M⊙, angular momentum losses due to stellar winds are far less significant than the effects of binary spin-up interactions (Holgado et al. 2022; Britavskiy et al. 2024).
The bimodal distribution found in different regions, both galactic and extragalactic, shows that, at least to first order, the bimodality should be independent of metallicity up to Z = 0.5 Z⊙. However, the Cygnus OB2 association, located within Cygnus-X complex, presents a remarkable lack of O-type stars rotating above 200 km s−1 (Berlanas et al. 2020). Given that more than 70% of O-type stars are expected to undergo binary interactions throughout their lives (Sana et al. 2012), a substantial fast-rotating population is expected within such an active and massive star-forming region as Cygnus OB2. The apparent absence of such population raises a significant challenge to current evolutionary models; they predict that fast rotators should emerge as a natural consequence of multiplicity and binary interactions.
Stellar rotation can be the dominant process that shapes the spectral lines of O-type stars; thus, high rotational velocities may lead to spectral misclassifications (Markova et al. 2011; Galán-Diéguez et al., in prep.). In addition, the disparity of criteria in stellar classification and variations in data quality (signal-to-noise and/or spectral resolution) can further contribute to classification errors. Given that the high-velocity tail largely consists of stars with masses < 32 M⊙ (typically late-O types), and the potential impact of rotation on classification (especially toward B-type stars, vanishing the He IIλ4552 line; Galán-Diéguez et al., in prep.), this work focuses on the study of the B0 population in Cygnus OB2. Our aim is to assess whether some early-B stars are actually fast-rotating late-O types, potentially restoring the expected fast-rotator tail in the rotational velocity distribution.
This paper is organized in six main sections as follows. Section 2 describes the observational campaign and sample selection. In Sect. 3 we introduce the methods and tools used for the spectral classification of our B0 stars; we also examine the effects of rotation on late-O and B0 classification. In Sect. 4 we outline the approach to line-broadening characterization, and present the new projected rotational velocities from our new late-O and B0 sample. Section 5 presents some explanations that can potentially account for the absence of fast rotators in Cygnus OB2. Finally, in Sect. 6 we summarize the main conclusions of this work.
2. Observational sample
The star sample used in this work is comprised of known members of Cygnus OB2, which are classified as B0-types in the literature within 1° centered on Galactic coordinates l = 79.8° and b = +0.8°. Two stars (2MASS J20324719+4117500 and J20324863+4114298) were excluded from the final sample due to low B magnitudes, making them unsuitable for blue-range observations and subsequent spectral classification. Ultimately, the selection process yielded a final sample of 32 stars, with coordinates and photometric magnitudes provided in Table A.1.
The observation campaign was conducted during multiple runs using different telescopes (see Table 1). We performed observations with the 2.56 m Nordic Optical Telescope (NOT) during a single three-night run (October 9–11, 2024) with the Alhambra Faint Object Spectrograph and Camera (ALFOSC) and its grism #17, which provides a spectral resolution R ∼ 5000 at 6580 Å (CCD14). For the 10.4 m Gran Telescopio Canarias (GTC) observations, we used OSIRIS+ in filler mode and long-slit configuration with the R2000B grism (R ∼ 2165 at 4755 Å). The spectral properties of the OSIRIS+ data allowed us to reclassify the B0-type stars of Cygnus OB2, using specific classification ratios in the blue optical range. Our configuration of the ALFOSC instrument also enabled the confident detection of stars exhibiting high rotational velocities (v sin i > 200 km s−1). While its spectral resolution is insufficient for precise measurements of low v sin i, it is fully appropriate for our primary goal, which is the identification of fast rotators within the observed sample. Furthermore, we conducted two additional observation nights in the 2.54 m Isaac Newton Telescope (INT) with the Intermediate Dispersion Spectrograph (IDS) and its 1200B grating (R ∼ 4600).
Telescopes, instruments, and settings used in this work.
To complete our data and confirm the results, we reviewed the existing literature for additional spectra of our sample stars. We used the Galactic O-Star Spectroscopic Survey (GOSSS), which provides extensive blue-violet and high S/N spectra of Galactic O-type stars at resolutions of R ∼ 2500 − 3000 (Sota et al. 2011, 2014; Maíz Apellániz et al. 2016). The GOSSS spectra used in this work were acquired with two different instruments: the OSIRIS spectrograph at the GTC, and the TWIN spectrograph at the 3.5 m Calar Alto Observatory telescope (CAHA, Centro Astronomico Hispano-Alemán). We also collected spectra from Berlanas et al. (2018a), observed at the 4.2 m William Herschel Telescope (WHT, ORM) using the Intermediate-dispersion Spectrograph and Imaging System (ISIS) and the Wide-field Fibre Optic Spectrograph (WYFFOS). We also included Berlanas et al. (2020) data from IDS@INT.
The details of the observational runs and data characteristics are summarized in Table 1. The final spectra from the NOT and GTC telescopes were processed with PypeIt, a Python package for semi-automated spectroscopic data reduction (Prochaska et al. 2020a,b). The data from the INT observations were reduced using PyRAF (Science Software Branch at STScI 2012), following standard routines for bias and flat-field subtraction as well as wavelength calibration.
3. Spectral reclassification of the B0 population in Cygnus OB2
3.1. Effects of rotation in the late-O and early-B range for spectral classification
Stellar rotation can strongly affect the spectral features of massive stars. As demonstrated by Markova et al. (2011) and Galán-Diéguez et al. (in prep.), rotational velocity, inclination, and signal-to-noise ratio can significantly alter the profiles and relative depths of key diagnostic lines. One of the most critical indicators in the late-O to early-B region is the depth ratio of He IIλ4542/He Iλ4388, which plays a key role in spectral classification (Sota et al. 2011). This ratio is particularly sensitive to rotational broadening.
In late-O stars, increasing v sin i weakens He I faster than He II, shifting the line depth ratio toward values typically associated with earlier spectral types (Galán-Diéguez et al., in prep.). In contrast, for early-B stars (B0.2–B0.5), the He IIλ4542 line is already weak at these effective temperatures, and it becomes increasingly difficult to detect for v sin i ≳ 200 km s−1. As a result, the line ratio trend is inverted, mimicking later spectral types.
This effect of rotation becomes particularly problematic at the O9.7 subtype, which lies in the transition zone from O- to B-types. At high rotational velocities, O9.7 stars can exhibit He IIλ4542/He Iλ4388 ratios that closely resemble those of B0 stars. As a result, fast-rotating O9.7 stars are especially prone to being misclassified as early-B types. This bias may be intensified by diverse classification criteria and heterogeneous data quality (moderate-resolution spectra with limited S/N, a common scenario in large-scale surveys).
These results suggest that some stars cataloged in the literature as B0 in Cygnus OB2 might in fact be fast-rotating late-O stars misclassified due to rotational effects and observational constraints. This scenario has relevant implications. Since the rotational velocity distribution of O-type stars is known to be bimodal – with fast rotators generally being late O-types below 32 M⊙ (Holgado et al. 2022) – such misclassifications might potentially account for the observed lack of high-v sin i stars in Cygnus OB2.
3.2. Updated spectral types for the B0 population of Cygnus OB2
An accurate spectral classification (including rotational effects) of the B0 population within Cygnus OB2 is crucial for understanding this region of intense massive star formation. However, discrepancies are present in the literature, likely related to differences in spectral resolutions, signal-to-noise ratios, and classification criteria. To ensure a consistent classification, we followed the criteria described in Sota et al. (2011) – specifically in their Table 4 – which lists the diagnostic line ratios for O- and early B-type stars. In particular, the relative strengths of He IIλλ4542, 4200, He Iλλ4388, 4144, and Si IIIλ4552 are used to distinguish between spectral subtypes.
To facilitate the classification we used the Marxist Ghost Buster code (MGB, Maíz Apellániz et al. 2015). This IDL-based script compares the observed spectrum against a two-dimensional grid of standard stars organized by spectral type and luminosity class. By overplotting the spectra, we identified the standard star that best matched the diagnostic line ratios of the sample star, thereby determining its spectral type and luminosity class. MGB incorporates O-type standards from the GOSSS catalog (Maíz Apellániz et al. 2016), and a private collection of B stars kindly provided by Dr. Maíz Apellániz. Furthermore, MGB allows the user to interactively broaden the standard spectra by applying rotational convolution, enabling a more accurate comparison when the observed star shows significant line broadening. This functionality is particularly helpful for rapidly rotating stars, as it facilitates the accurate classification when line broadening may lead to misclassifications if not properly accounted for. A detailed example of this reclassification procedure – including the analysis of helium and silicon line ratios and the use of MGB – is provided in Appendix C.
Table B.1 lists the updated spectral types, together with previous types from the literature. Our results generally agree with previous classifications, with most differences within one spectral subtype or luminosity class. However, the central core of our analysis is deeply related to subtle variations of spectral subtypes within the B0 population of Cygnus OB2. Our updated classification reveals that approximately 19% of the stars previously identified as B0 are actually late-O types; indeed, all these reclassified O-type stars fall within the O9.7 subtype, except 2MASS J20295701+4109538, which is classified as O9.5.
4. Projected rotational velocities of O- and B0-type stars in Cygnus OB2
4.1. Line-broadening characterization
Projected rotational velocities (v sin i, where i is the inclination angle of the stellar rotation axis relative to the line of sight) are measured directly from spectral line broadening. Common techniques for measuring v sin i include the full width at half maximum (FWHM) approach (Slettebak et al. 1975; Herrero et al. 1992; Abt et al. 2002; Strom et al. 2005), cross-correlation with template spectra (Penny 1996; Howarth et al. 1997), and profile fitting using synthetic lines from model atmospheres (Ryans et al. 2002; Mokiem et al. 2006; Hunter et al. 2008). The Fourier transform (FT, Carroll 1933; Smith & Gray 1976; Dravins et al. 1990; Gray 2008, and references therein) is a extremely useful method for early-type stars, as it effectively disentangles rotational broadening from other effects, such as macroturbulence.
For this study, we derived v sin i values for the B0 star sample with spectra from the 2.56 m NOT, 2.54 m INT and 4.2 m WHT telescopes, using the iacob-broad tool (Simón-Díaz & Herrero 2014). This IDL-based script computes v sin i and macroturbulence (vmac) using both the FT and goodness-of-fit (GOF) methods on selected diagnostic lines. The FT approach is based on the Fourier transform of a specific line profile, using the first zero to determine v sin i (Simón-Díaz & Herrero 2007; Gray 2008). The GOF technique involves matching an observed line profile with a synthetic profile convolved with varying v sin i − vmac values, optimizing the fit through χ2 minimization. By providing two independent v sin i measurements, iacob-broad enhances consistency checks and helps resolve challenging cases in broadening characterization.
Given the available spectra for our star sample (which vary significantly in spectral resolution), we first prioritized the highest possible resolution when measuring the rotational velocities. As a secondary criterion, we favored metallic lines (Table 2), since they are not affected by significant Stark broadening or by nebular contamination. However, when these lines were not available, we followed the selection criteria established in Herrero et al. (1992), Simón-Díaz & Herrero (2014), and Berlanas et al. (2020):
-
(i)
Initially, we selected the O IIIλ5592, Si IVλ4116, Si IIIλ4552, and Si IIλ6347 lines. The O IIIλ5592 line is typically stronger and more isolated for O-type stars.
-
(ii)
If none of the previous metallic lines were available, we used nebular-free He I lines, which are typically less affected by Stark broadening than He II lines.
-
For the NOT spectra, we used He Iλ6678, carefully excluding the red part of the line in O-type stars to avoid potential contamination from He IIλ6683. The bulk of our v sin i measurements are derived from this line (see Table 2), in order to take advantage of the superior signal-to-noise ratio and spectral resolution of the NOT spectra.
-
For the rest of the spectra, we adopted an unweighted average of the lines He Iλλ4388, 4471, 4713, 4922 (He I reference in Table 2). In the case of He Iλ4471 and He Iλ4713, we excluded the blue component of the line if the forbidden component – indicating strong Stark effects – was present.
-
Diagnostic spectral lines used in iacob-broad to compute the projected rotational velocities (v sin i).
To ensure the robustness of our results, we compared the v sin i values obtained using the FT technique with those derived from the GOF approach, as shown in Fig. 1. Whenever possible, we prioritized using rotational velocities computed through the GOF procedure, provided that their FT counterparts fell within the adopted uncertainty range. This method reduces potential subjectivity when selecting the first zero in the Fourier transform. Based on the agreement observed between the two methods in our data, we adopted an uncertainty of 20 km s−1 or 20%, whichever was greater (see Fig. 1); at lower rotational velocities, additional broadening from spectral resolution and microturbulence may increase the uncertainties.
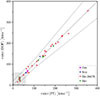 |
Fig. 1. Comparison of projected rotational velocities resulting from iacob-broad, using the Fourier transform (FT) and the goodness-of-fit (GOF) methods. The dashed lines indicate deviations of 20 km s−1 or 20% (whichever is the largest) from the 1:1 correlation. The gray-shaded square denotes rotational velocities below the c/R threshold, estimated for a spectral resolution of R = 5000. The green squares show those v sin i in which GOF(vmac) = 0 is used. |
Even so, Simón-Díaz & Herrero (2014) note that spectral sampling imposes a lower limit below which rotation no longer dominates the broadening of spectral lines – although v sin i can still be determined. This limit is defined as
 (1)
(1)
mainly resulting in (v sin i)lim ∼ 60 km s−1 for most of our computed velocities; the gray-shaded box in Fig. 1 highlights the region below this limit. Within this domain, the spectral resolution is insufficient to accurately fit v sin i − vmac in the GOF procedure. In addition, when applying the FT technique, velocities below the (v sin i)lim threshold are close to the Nyquist frequency, leading to edge effects in the Fourier transform. Hence, we found in this region the only three cases where the FT-GOF results fell outside the reliable bounds, forcing us to adopt the v sin i values computed from the GOF(vmac) = 0 method (green squares in Fig. 1). As a result, in the low-rotation regime the precision of our v sin i measurements is increasingly compromised for lower and lower velocities, as instrumental broadening tends to dominate over rotational effects. However, in our work, this limitation is not critical since our main goal is to identify and characterize fast rotators within Cygnus OB2; stars with v sin i values below the approximate threshold (v sin i)lim lie outside the primary scope of our analysis and do not affect our conclusions.
A similar argument applies to the impact of Stark broadening when using He I lines for v sin i computation. Although the agreement between our v sin i(FT)−v sin i(GOF) results confirms their reliability, our main interest remains fast rotators, for which rotational broadening is the dominant mechanism.
In Table B.1 we present the projected rotational velocities of our sample of stars, which are further analyzed in Fig. 2. The spectral reclassification detailed in Sect. 3 resulted in the identification of six new O stars, while the remaining 26 stars retain their classification as B-types. Notably, our sample includes only six stars with rotational velocities v sin i > 200 km s−1, of which only one O-type star exceeds this threshold.
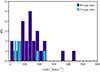 |
Fig. 2. Computed projected rotational velocities for the star sample in this work. Different shades of blue represent the corresponding spectral types (O- or B-type) after our spectral reclassification. |
4.2. Cygnus OB2 rotational velocity distribution from its O-type population
In this section we compare our v sin i measurements of Cygnus OB2 O-type stars with those from similar studies in Figs. 3 and 4. The reference works comprise: (i) Berlanas et al. (2020), which concentrates on the O-type population of Cygnus OB2; (ii) Holgado et al. (2022), focusing on Galactic O stars from the solar neighborhood; (iii) Ramírez-Agudelo et al. (2013), which examines O-type stars in 30 Doradus; (iv) Berlanas et al. (2025), studying O stars in Carina OB1; and (v) Dufton et al. (2019), which measures O- and B-type stars in NGC 3461.
 |
Fig. 3. Projected rotational velocities for the O-type population in Cygnus OB2. Left: histogram representing all v sin i values for the Cygnus OB2 O-type stars (in orange), combining results from this study with those from Berlanas et al. (2020). The rotational velocities computed in this work for O stars are plotted in blue. Middle: v sin i data for O-type stars with spectroscopic masses M < 32 M⊙ (in violet, Berlanas et al. 2020). Right: v sin i results from Holgado et al. (2022) for Galactic O-type stars with M < 32 M⊙ (gray histogram). The cyan overlay merges the blue and violet histograms from the middle panel. |
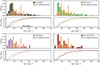 |
Fig. 4. Distribution of projected rotational velocities for O-type stars v sin i across different regions of the local Universe. The histograms in black, green, purple, and brown represent the v sin i measurements for Galactic stars in the solar neighborhood (Holgado et al. 2022), 30 Doradus (Ramírez-Agudelo et al. 2013), Carina OB1 (Berlanas et al. 2025), and NGC 346 (Dufton et al. 2019), respectively. The orange histogram displays the rotational velocity distribution for Cygnus OB2, integrating O-type stars from Berlanas et al. (2020) with those newly identified in our reclassification of the B0 sample. |
Most of these studies used iacob-broad to characterize line broadening, but with slightly different approaches regarding the diagnostic lines. Ramírez-Agudelo et al. (2013), Berlanas et al. (2020) (hereafter [SRB20]), and Berlanas et al. (2025) followed criteria similar to ours, prioritizing O IIIλ5592 and Si IIIλ4552. By comparison, Holgado et al. (2022) (henceforth [GH22]) primarily relied on O IIIλ5592, but also used Si IIIλ4552, N Vλλ4603, 4620 and N IVλ6380 when the O III line was too weak. In contrast, Dufton et al. (2019) did not use iacob-broad; instead, they estimated v sin i from independent FT and profile fitting applied to Mg IIλ4481, Si IIIλ4552, or He Iλ4026, depending on the spectral type and line quality.
In Fig. 3 (left and middle panels) we present in blue the projected rotational velocities of our newly classified O stars within Cygnus OB2. The orange histogram illustrates the combination of those results with the v sin i values of [SRB20], computed from the O-type population of Cygnus OB2. These authors identified a distribution of rotational velocities with a peak of slow rotators at 80 − 120 km s−1, with no sign of stars rotating above 250 km s−1. In the middle panel, we specifically highlight O-type stars from [SRB20] with spectroscopic masses below 32 M⊙, shown in violet. The right panel merges the previous blue and violet histograms into a new one colored in cyan. This is then compared to the v sin i histogram of O stars with stellar masses below 32 M⊙ from [GH22] (in gray). We used 32 M⊙ non-rotating evolutionary tracks from Ekström et al. (2012) with solar metallicity Z = 0.14 to identify the M < 32 M⊙ stars.
Figure 3 (left panel) clearly indicates that Cygnus OB2 rotational velocities (shown in orange) are skewed toward higher v sin i values. This observed shift highlights the impact of spectral resolution on the accurate computation of stellar rotation: when rotational velocities fall below (v sin i)lim, both the FT and GOF methods face significant limitations, leading to an overestimation of the computed v sin i (see Sect. 4.1). The main peak of slow rotators identified by [SRB20] (v sin i ≤ 100 km s−1) mainly consists of stars observed at R ∼ 5000, causing a shift to higher velocities. This effect is similarly present in our study, yet it is amplified as we assumed GOF(vmac) = 0 for most of the low-regime cases; in this range, our v sin i values are even further overestimated as iacob-broad fails to effectively disentangle the rotational and macroturbulence velocities.
The middle and right panels of Fig. 3 focus on galactic stars with spectroscopic masses < 32 M⊙. Simulations of binary populations (de Mink et al. 2013) and the analysis of O-type galactic stars (Holgado et al. 2022) suggest that the fast-rotating tail in the rotational velocity distributions of massive stars is primarily populated by stars in this mass range. However, the middle panel highlights a significant pattern in Cygnus OB2: its O-type population exhibits no evidence of stars rotating at 250 km s−1 or higher (violet histogram). This absence becomes even more clear in the right panel when compared with results from [GH22]: we do not find an extended tail of fast rotators in Cygnus OB2, even after incorporating into [SRB20] our v sin i results – which involve newly identified O stars from our B0 sample.
We also compare the distribution of rotational velocities for O stars in Cygnus OB2 with those from other regions in Fig. 4. Presented from left to right, top to bottom, the results include: the Galactic O stars from [GH22] in black; the O-type stars in 30 Doradus (Ramírez-Agudelo et al. 2013) in green; the O-star population of Carina OB1 (Berlanas et al. 2025) with purple color; and the O stars from NGC 346 (Dufton et al. 2019) in brown. The projected rotational velocities for the O-type stars of Cygnus OB2, including the results from [SRB20] and our work, are shown in orange.
The [GH22] data exhibit a bimodal distribution (top-left panel), characterized by a peak of slow rotators at 40 − 80 km s−1 and a high-velocity tail extending up to 450 km s−1. In contrast, the Cygnus OB2 population lacks this extended tail, with rotational velocities reaching only ∼270 km s−1; in addition, its shift in the low-velocity peak can be attributed to the constraints imposed by spectral resolution, as stated for Fig. 3. The top-right panel of Fig. 4 highlights further contrasts. While Cygnus OB2 and 30 Doradus are both young, massive star-forming regions, they exist in different environments: Cygnus OB2 is located in the solar neighborhood, whereas 30 Doradus resides in the Large Magellanic Cloud, an extragalactic region with lower metallicity (ZLMC = 0.43 Z⊙, Choudhury et al. 2016). Even so, 30 Doradus continues to display a bimodal distribution, exhibiting a peak at 60 − 80 km s−1 and a fast-rotator tail that reaches 600 km s−1. Its apparent absence of very slow rotators is likely due to a higher detection threshold at low v sin i, a consequence of limited spectral resolution. Finally, O-type stars in NGC 346 also follow a broad distribution of rotational velocities, peaking around 80 − 100 km s−1 and with evidence of fast rotators above 300 km s−1. This young, massive, star-forming region – despite its different environment within the Small Magellanic Cloud (ZSMC = 0.14 Z⊙ Trundle et al. 2007; Hunter et al. 2007) – also hosts a significant number of rapid rotators, in contrast with Cygnus OB2.
Notably, Carina OB1 shows a v sin i distribution similar to Cygnus OB2, characterized by a remarkable absence of fast rotators (bottom-left panel in Fig. 4). Moreover, its distribution shows a well-defined peak at low v sin i, closely resembling the pattern seen in the Galactic population. This low-velocity peak of Carina OB1 results from the high-resolution data, which reduces the detection threshold and shifts the observed distribution toward lower velocities.
In conclusion, resolution effects introduce an artificial shift in the low-velocity regime. Still, the lack of rapid rotators in Cygnus OB2 remains evident, even after adding the newly classified late-O stars from the B0 sample. The rotational velocity distribution shows no extended high-velocity tail, in contrast to what is observed in other environments such as the Milky Way and 30 Doradus. This persistent difference suggests that the population of massive stars in Cygnus OB2 may have undergone a distinct evolutionary or environmental history that limits the presence of fast rotators.
4.3. Rotational velocities for the Cygnus OB2 OB-type population
In this section we include the B0 stars from Cygnus OB2 on its rotational velocity distribution (see Fig. 5). In our sample, we identify four B0 stars with v sin i > 200 km s−1, with only two exceeding 250 km s−1. These results slightly improved the representation of high rotational velocities within the distribution.
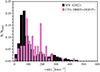 |
Fig. 5. Projected rotational velocities from the O+B0 population of Cygnus OB2 (shown in pink), compared with the v sin i distribution of Galactic O stars (in black, Holgado et al. 2022). The Cygnus OB2 distribution contains results obtained by Berlanas et al. (2020) (O-type stars) and all the v sin i computed in this work (new O and B0 stars). |
Notably, this subtle improvement is in line with trends observed in stellar rotation studies. Large-scale surveys, such as that by Huang et al. (2010), have shown that early B-type stars generally present higher rotational velocities compared to their more massive O-type counterparts, particularly at the zero-age main sequence. This correlation with mass may suggests that including B0 stars in the Cygnus OB2 sample will increase the number of rapid rotators. However, according to Fig. 5, this does not alter our main conclusion: Cygnus OB2 lacks an extended tail of fast rotators for the more massive stars.
5. Discussion
The high multiplicity fraction of massive stars suggests that the bimodality observed in the rotational velocity distributions of O-type stars is likely driven by binary interactions (de Mink et al. 2014; Holgado et al. 2022; Britavskiy et al. 2024), although alternative explanations have also been proposed (e.g., Nazé et al. 2024). In Sect. 4.2, we compare the projected rotational velocities in Cygnus OB2 against distributions from other Galactic and extragalactic regions, and detect the absence of a fast-rotating tail in Cygnus OB2. The probability density function, f(x), for the distributions of Holgado et al. (2022) and Ramírez-Agudelo et al. (2013), calculated as
 (2)
(2)
reveals that the probability of finding O-type stars with v sin i > 200 km s−1 is approximately 0.18 and 0.25, respectively. Within the Cygnus OB2 region, this would imply the presence of 13 to 18 O stars in this high-velocity range. Theoretical simulations by de Mink et al. (2013) predict that roughly 19% of hot massive stars will reach rotational speeds exceeding 200 km s−1, aligning closely with the empirical probabilities obtained by Holgado et al. (2022). However, in Cygnus OB2, we identified only nine O-type stars with v sin i > 200 km s−1 (∼14%), a fast-rotating population smaller than both theoretical and empirical predictions. The discrepancy is even worse for v sin i > 250 km s−1, where 10 − 12 O stars are expected, yet only three are observed.
Following the initial study of the O-star population (Berlanas et al. 2020), and our additional analysis of stars with M < 32 M⊙ (newly identify late-O types), we confirmed the lack of an extended tail of fast rotators in Cygnus OB2. In the following sections, we explore several potential explanations for this observed deficit of fast-rotating stars in the region: (i) the early stage of Cygnus OB2, with insufficient time for spin-up via binary interactions; (ii) environmental conditions that may suppress binary formation or lead to slower initial rotations; (iii) the dynamical ejection of fast rotators as runaway stars; (iv) spin-axis alignment, which could lower projected velocities; and (v) magnetic braking as a mechanism for rotational slowdown.
5.1. Evolutionary effects
Massive stars often form in binary systems, where strong gravitational attraction leads to high multiplicity (Sana et al. 2012). This multiplicity plays a pivotal role in shaping the evolution and fate of massive stars, which are heavily influenced by the interactions and evolutionary stages of their companions. Particularly, spin rates in binary systems are modified by tidal forces and mass transfer processes (see Fig. 6). Such interactions are not present in isolated stars, but they significantly spin up one or both components of the system.
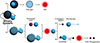 |
Fig. 6. Schematic evolutionary paths of a massive binary system. Initially, if the two stars orbit close enough to each other, they may eventually merge, forming a single, more massive star (top path). Alternatively, the more massive star may explode as a supernova (SN), potentially ejecting the companion as a high-velocity runaway star or resulting in a system with a compact object. The companion may later undergo its own SN event, creating a double compact-object system that could eventually merge and emit gravitational waves (bottom paths). |
During the initial pre-interaction phase, both stars remain within their Roche lobes in a detached configuration, with interactions limited to stellar winds and tidal forces (de Mink et al. 2013). For P < 10 d, tidal interactions dominate the spin rate change, working to synchronize the rotation of each star with their shared orbital motion. As this synchronization process occurs, it tends to equalize the angular velocities of both stars. This keeps the primary star in corotation with the orbit as it expands, and gradually increases its rotation until critical velocity is reached. Consequently, the primary can spin up to a rotational velocity exceeding 200 km s−1 before filling its Roche lobe – with 300 km s−1 as an upper limit that tidal forces can achieve alone.
The age of the O-type population in Cygnus OB2 is estimated between 1 and 6 Myr, with evidence of at least two main star formation episodes (Berlanas et al. 2020). These findings are consistent with Negueruela et al. (2008), who proposed an age of ∼2.5 Myr for the association, while also detecting a slightly older population. Furthermore, Wright et al. (2015) suggested a continuous star formation period spanning from 1 to 7 Myr, supporting this age range. This maximum age of 6−7 Myr for the massive stellar population of Cygnus OB2 aligns with the fact that only tides produce a significant spin-rate change during the pre-interaction phase; our v sin i results together with those from Berlanas et al. (2020) show that approximately 86% of the O-type stars in Cygnus OB2 have rotational velocities below 200 km s−1, while no star exceeds 300 km s−1.
The lack of an extended fast-rotating tail in Cygnus OB2 could be attributed to tidal forces alone driving spin rate changes as mass transfer events are typically expected after 8−10 Myr. Indeed, the full potential of tidal acceleration may not yet have been reached, as reflected by the relatively modest population with velocities between 200 − 300 km s−1 (only nine stars in Cygnus OB2). Despite a young evolutionary stage, it remains possible to find stars with velocities over 300 km s−1 in cases where mergers have occurred within the tightest binary systems (de Mink et al. 2013), although this situation is unclear. Within Cygnus OB2, we find only one star with v sin i ∼ 270 km s−1 (Berlanas et al. 2020), potentially resulting from a merger according to the young age of the region.
However, observations of other regions indicate that age alone is insufficient to explain the absence of a well-populated high-velocity tail in Cygnus OB2. In 30 Doradus, Ramírez-Agudelo et al. (2013) compared the rotational velocity distributions of the slightly older cluster NGC 2060 (5 Myr) and the younger NGC 2070 (1−2 Myr, Schneider et al. 2018), observing no significant difference: both clusters exhibit a pronounced peak of slow rotators and a high-velocity tail extending up to ∼600 km s−1. NGC 346 also presents a fast-rotating population despite its young age (≳3 Myr, Dufton et al. 2019). Crucially, the young evolutionary stage of their O-type populations does not seem to have strongly affected the v sin i distributions. In contrast, Berlanas et al. (2025) do not report the presence of an extended tail of fast rotators in Carina OB1. This region is one of the youngest associations in the Galaxy and it contains Trumpler 14, which has an estimated age of 1 Myr (Sana et al. 2010; Berlanas et al. 2025).
These differences in rotational velocities – despite similar evolutionary statuses – suggest that the lack of fast rotators in Cygnus OB2 cannot be explained by age alone. Instead, it likely reflects a more complex interplay between the evolutionary stage and additional physical factors.
5.1.1. The low-velocity population in Cygnus OB2
The presence of a high fraction of low-v sin i stars in Cygnus OB2, combined with the absence of a well-populated high-velocity tail, also suggests the importance of its evolutionary stage. Considering that slow and fast rotators might originate from binary interactions, then we would expect that both populations would be similarly affected by evolutionary processes. However, we observe slow rotators, but no fast rotators.
Recent hydrodynamic simulations by Schneider et al. (2019) offer a potential explanation. Binary mergers increase angular momentum during the beginning of the merging phase, but rapidly lose it due to strong mass loss. As a result, merger products become magnetic slow rotators. Binary mergers are also expected to constitute a non-negligible fraction of pre-main sequence stars (up to ∼30%, see Tokovinin & Moe 2020), and this fraction may increase by  before ∼10 Myr when considering evolution of binary systems (de Mink et al. 2013, 2014).
However, the O-star population in Cygnus OB2 (1−6 Myr) is not old enough to explain the lack of fast rotators as a result of a large number of mergers. While binary evolution and mergers may contribute to the slow-rotator population, they cannot fully account for the absence of fast-rotating stars. The high fraction of low-v sin i stars in Cygnus OB2 may instead indicate that some stars are simply born as slow rotators, reflecting an intrinsic distribution of angular momentum at birth. From this perspective, initial star formation conditions – such as angular momentum transport and magnetic braking – likely play a key role in shaping the observed low-rotation properties.
5.2. Properties of the molecular cloud
5.2.1. Multiplicity fraction
During the gravitational collapse of a molecular cloud, the conservation of momentum leads to a greater concentration of angular energy in the central region. This phenomenon should result in most forming stars rotating near critical velocities; however, since extreme rotators among massive O-type stars are rare, there must be mechanisms to transport away angular momentum. Several explanations have been proposed to resolve this discrepancy, including disk-mediated accretion (Lin et al. 2011) and magnetic coupling (Mouschovias 1998). Still, the impact of their spin-down effect would not be sufficient (e.g., Rosen et al. 2012). The most accepted explanation, supported by observations, is that massive stars form in multiple systems, redistributing angular momentum into orbits and reducing the need for high initial spins. Indeed, multiplicity is intrinsic to massive stars (Sana et al. 2012), with a close binary fraction of ℱbin = 0.69 ± 0.09.
5.2.2. I. Dependence on the molecular cloud
The exact formation mechanisms of multiple massive star systems remain poorly constrained (Offner et al. 2023). Current theories can be broadly grouped into three categories: (i) fragmentation of a molecular core or filament, (ii) gravitational instability within a massive accretion disk, or (iii) fragmentation through dynamical interactions.
These pathways do not act in isolation. Feedback mechanisms (such as radiation, protostellar outflows, magnetic fields, and turbulence) can reshape the gas distribution and regulate star formation rates (Offner et al. 2023). In doing so, they influence formation outcomes and the resulting multiplicity fraction. If such mechanisms had strongly suppressed the formation of multiple systems in Cygnus OB2, the binary fraction would be lower. Fewer binaries then mean fewer interactions to spin up secondary stars, leaving a smaller population of rapid rotators.
In addition, these feedback mechanisms may also influence the distribution of orbital separations. For instance, if binaries tend to form with wider orbits in Cygnus OB2, tides and mass transfer episodes would be less efficient. This would reduce the number of high-velocity stars and help explain the observed scarcity of fast rotators.
5.2.3. II. The influence of metallicity
Observational studies support that the formation of close binaries is largely independent of metallicity. Sana et al. (2025) report a slight anticorrelation between metallicity and the fraction of close massive binaries, with
 (3)
(3)
for the O-type population. However, this trend is not statistically significant and the fraction of close massive binaries is similar across different metallicity environments. This suggests that metallicity has little effect on their formation.
In summary, metallicity does not appear to significantly affect the formation of close massive binaries, where interactions such as tides and mass transfer can produce fast-rotating stars. This is supported by the presence of fast rotators in regions with different metallicities, such as 30 Doradus (ZLMC = 0.43 Z⊙ Choudhury et al. 2016) and the solar neighborhood (Z ∼ Z⊙). Therefore, the scarcity of a fast-rotating tail in Cygnus OB2 cannot be explained by metallicity altering the binary fraction.
5.2.4. III. Dynamical interactions
Survival of multiple systems depend on the density history of their birth region (Wright et al. 2023). After formation, these binary and multiple systems can be altered or destroyed by processes such as secular decay (particularly in high-order systems) and external dynamical encounters. Close encounters are more frequent and energetic in high-density regions, disrupting existing systems and reducing multiplicity. In contrast, low-density environments shield stellar systems from such interactions, allowing them to remain largely unaltered.
Evidence presented by Griffiths et al. (2018) shows that the presence of wide binaries in Cygnus OB2 is inconsistent with a dense cluster origin, where such systems are typically disrupted. Instead, the survival of these systems within Cygnus OB2 is indicative of its low-density nature. Thus, in associations like Cygnus OB2, stars are less affected by external encounters or irradiation (Wright et al. 2014). However, secular processes may still play a role in shaping multiplicity. Consequently, it is unlikely that dynamical interactions have significantly modified its primordial binary fraction.
Despite, a low multiplicity fraction in Cygnus OB2 – set by its formation conditions rather than by dynamical interactions – may account for the absence of a fast-rotating tail. With fewer close binaries, key spin-up mechanisms such as tidal forces and mass transfer are less frequent, leading to a lower number of fast rotators compared to other regions.
5.2.5. Stellar formation as a regulator of initial rotation
Observed variations in rotational velocities among early-B stars in high- and low-density environments are likely driven by differences in their formation conditions (see Wolff et al. 2007). According to magnetically-regulated accretion models (Koenigl 1991; Shu et al. 1994; Long et al. 2005; Matt & Pudritz 2005), the inital stellar rotation is given by
 (4)
(4)
where M is the stellar mass, Ṁacc is the accretion rate, B is the magnetic field, and R is the radius of the star.
In dense environments, higher core densities contribute to shorter collapse times and higher accretion rates during stellar assembly (McKee & Tan 2003). Therefore, stars are expected to initially rotate faster. In addition, circumstellar disks in dense clusters are easily disrupted; photoevaporation from nearby O stars (Johnstone et al. 1998; Weidner & Kroupa 2006; Shen & Lou 2006) and gravitational interactions (Pfalzner et al. 2006) shorten disk lifetimes. These processes limit the period over which magnetic coupling can remove angular momentum, allowing stars to retain higher rotation rates when forming.
In contrast, O stars within Cygnus OB2 likely formed in a low-density environment. Thus, longer-lived disks and lower accretion rates may have led to slower rotational velocities at birth. As a result, spin-up from tides and mass transfer might be less evident at the current age of Cygnus OB2, thus explaining its observed lack of fast rotators.
5.3. Runaway scenario
As a massive binary system evolves, it can follow several evolutionary paths (see Fig. 6). Typically, the more massive star will evolve faster, eventually reaching the supernova stage. The SN explosion may disrupt the system, ejecting the companion at high velocity as a runaway star. This runaway is left behind as a single star that moves across the sky with a relatively large proper motion.
During their initial evolutionary stages, binary stars are in a pre-interaction phase, when only tidal forces affect their rotation. In this phase, stars may experience either acceleration to velocities between 200 − 300 km s−1 or deceleration when their initial velocities exceed 300 km s−1 (de Mink et al. 2011, 2013). After this stage, binaries with orbits that are large enough to avoid merging enter in a mass-transfer state from the primary to the secondary (path [B] in Fig. 6). This mass exchange occurs via Roche-lobe overflow, with angular momentum transferred either by direct impact onto the secondary’s surface (in short-period systems, P ∼ 2 − 5 d) or via an accretion disk (for longer periods, P ∼ 5 − 100 d). Following mass transfer, the primary may become a stripped star if it does not first explode as an SN, while the secondary turns into a massive fast-rotating star in the range of 300 − 600 km s−1.
Throughout the evolution of a binary system, the secondary star spins up through tidal forces and mass transfer. If the primary star undergoes a SN explosion and ejects the secondary (Fig. 6 path [B1]), the resulting runaway star is expected to retain a high rotational velocity. Thus, a potential explanation for the observed lack of fast rotators in Cygnus OB2 is the spatial distribution of the observed population; the O-type stars analyzed by Berlanas et al. (2020) and in this work are concentrated within a 1° radius around its central region (see Fig. 7). Given the distance to Cygnus OB2 (1.74 kpc, Berlanas et al. 2019), a star ejected with a velocity of 30 km s−1 on the sky plane would only need 1 Myr to be outside the central area. Thus, fast rotators may now lie beyond the central region of Cygnus OB2, having been ejected as high proper motion runaway stars.
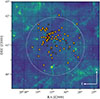 |
Fig. 7. MSX 8 μm image showing the spatial distribution of the O-type stars from Cygnus OB2 analyzed by Berlanas et al. (2020) (orange circles) and those identified in this work (pink triangles). The B0 population is plotted with squares in gray. For reference, the red star locates CygOB2 #8A, with J2016.0 coordinates RA = 20:33:15.078 and Dec = +41:18:50.479. The dashed circle defines a 1° radius region, centered on Galactic coordinates l = 79.8° and b = +0.8° (Knödlseder 2000). North is up, and east is to the left. |
Indeed, the observed spatial distribution of fast-rotating O-type stars in 30 Doradus provides empirical support for the runaway scenario. Ramírez-Agudelo et al. (2013) show that the high-velocity tail is significantly more populated among stars located outside the central clusters NGC 2070 and NGC 2060. Moreover, Sana et al. (2022) report an overabundance of rapid rotators (v sin i > 200 km s−1) among the runaway population (see their Fig. 4). This trend reinforces the idea that runaway stars could account for the missing population of fast rotators in Cygnus OB2.
5.3.1. Star sample and distance effect
It is also important to consider how distances to star-forming regions affect the spatial coverage and size of the observed samples. Cygnus OB2 lies at a distance of 1.74 kpc (Berlanas et al. 2019), so 2° on the sky corresponds to a physical radius of about 30 pc. In contrast, at the distance of 30 Doradus (51.7 kpc, Panagia 2005), the same angular size spans nearly 900 pc – 30 times the physical scale compared to Cygnus OB2.
These differences imply that observations of distant regions can naturally include stars over a much larger physical area, including a mix of cluster members and field stars. In contrast, our observations of Cygnus OB2 are constrained to its core – a smaller physical volume limited by both its proximity and our angular observation coverage. Consequently, our star sample is dominated by cluster members, with few field stars represented.
Assuming roughly constant and comparable stellar densities, the distance also impacts the relative number of stars observable in different regions. The smaller physical volume covered in Cygnus OB2 leads to a lower number of sampled stars compared to more distant regions, such as 30 Doradus (see Table E.1).
To properly account for sample size effects, we recomputed the v sin i distributions shown in Fig. 4 using the bootstrap resampling technique (see Appendix E for details). The bootstrapped distributions remain consistent with the original histograms, confirming that the observed lack of fast rotators in Cygnus OB2 is not a product of sampling or bin size. Instead, this new analysis reveals a statistically significant deficit, indicating that the absence of a high-velocity tail is intrinsic to the region. However, this conclusion remains potentially biased as a result of the restricted spatial coverage of the Cygnus OB2 sample.
5.4. Spin orientation
Spectroscopic data only provide projected rotation, as rotational velocities are derived from spectral line broadening. In this context, the lack of fast rotators in Cygnus OB2 could reflect a preferential alignment of stellar spin axes with our line of sight.
Simulations of star formation (e.g., Bate et al. 2003; Bate 2009a,b; Bate et al. 2010) indicate that chaotic accretion, disk fragmentation, and dynamical interactions effectively dissipate angular momentum and produce a random spin-axis distribution among forming stars. Empirical support for this scenario is provided by observations of Be stars, which exhibit circumstellar disks that appear randomly oriented (Hummel et al. 1999).
While an alignment of stellar spin axes has been observed in some clusters – such as NGC 6791 and NGC 6819, (Corsaro et al. 2017) – it is noteworthy that these systems are significantly older (on gigayear timescales) than Cygnus OB2 (1 − 6 Myr). Given this age difference, and considering the expected turbulence and dynamical interactions during massive star formation, a global spin-axis alignment in Cygnus OB2 is highly improbable. In any case, if such an alignment exists – with spin axes preferentially oriented toward our line-of-sight – it could lead to a systematic underestimation of rotational velocities in the observed O-type population of Cygnus OB2.
5.5. Magnetic fields
An alternative origin for magnetic fields (other than mergers) is the fossil field hypothesis. In this scenario, the magnetic field is produced during the star formation process with a stable, large-scale configuration (Duez & Mathis 2010). Moreover, theoretical models propose that rotation may drive internal dynamos, which are capable of generating magnetic fields (Spruit 1999).
In both scenarios, metallicity plays a key role in regulating angular momentum loss though magnetic fields. At higher metallicities, magnetic braking is more efficient (Li et al. 2023), potentially accounting the lack of fast rotators in Cygnus OB2. The higher metallicity environment of Cygnus OB2 compared to 30 Doradus (ZLMC = 0.5 Z⊙) may enhance angular momentum loss through magnetic fields, contributing to the scarcity of very fast rotators.
However, magnetic breaking appears to be an unlikely mechanism. Observations indicate that most O-type stars in the Milky Way show no detectable magnetic fields. Among the small number of confirmed magnetic O-type stars, surface field strengths are typically on the order of a few hundred gauss up to several kG (Donati & Landstreet 2009; Grunhut et al. 2012). While such fields are generally considered too weak to cause significant spin-down, the precise field strength required for effective braking remains uncertain.
Even so, theoretical models suggest that strong magnetic fields could form and remain confined to the stellar core, avoiding detection in the outer layers (Peres et al. 2019). If magnetic braking is indeed responsible for the lack of fast rotators within Cygnus OB2, this leads to the question of why similar effects are not observed in other massive star-forming regions.
6. Conclusions
We revisited the distribution of projected rotational velocities in Cygnus OB2, aiming to clarify the observed lack of fast rotators (v sin i > 200 km s−1) in its O-type population. This feature, initially identified by Berlanas et al. (2020), contrasts with theoretical predictions (de Mink et al. 2013) and observations from other Galactic and extragalactic populations (e.g., Holgado et al. 2022; Ramírez-Agudelo et al. 2015).
Our work contains a detailed spectral reanalysis of stars classified as B0 in Cygnus OB2. By combining new spectroscopic data with spectral classification tools (which incorporate rotational broadening), we identified significant misclassifications. We find that approximately 22% of our sample are actually late-O stars, predominantly O9.7. This suggests that some fast rotators may have been misclassified due to inconsistent classification criteria, limited signal-to-noise ratios, moderate spectral resolutions, and the impact of rotation on diagnostic lines.
Although we recovered some fast rotators after our reclassification, the number of stars with v sin i > 200 km s−1 remains notably limited: only ten O-type stars within Cygnus OB2 satisfy this threshold. This is significantly lower than both theoretical predictions and empirical evidence, which estimate that ∼19% of massive stars should occupy this high-velocity tail (see, for reference, de Mink et al. 2013; Ramírez-Agudelo et al. 2013; Holgado et al. 2022).
We consider that the deficit of fast rotators in Cygnus OB2 is most likely due to a combination of the following three factors:
-
Evolutionary stage: Given the young age of Cygnus OB2 (1 − 6 Myr; Berlanas et al. 2020), our results suggest that spin-up via mass transfer may not have occurred yet. Instead, tidal interactions – limited to boosting rotation up to 300 km s−1 – have likely dominated the angular momentum evolution so far. However, comparisons with older and younger stellar populations (e.g., NGC 2060 and NGC 2070 in 30 Doradus; Ramírez-Agudelo et al. 2013) show that age alone cannot explain the lack of fast rotators in Cygnus OB2.
-
Environmental properties: Certain star formation conditions in Cygnus OB2 may reduce binary formation and consequently reduce spin-up interactions. In addition, slow initial rotation – from longer disk lifetimes (e.g., Pfalzner et al. 2006; Shen & Lou 2006) and lower accretion rates (McKee & Tan 2003) during stellar formation in a low-density environment – likely contributes to the lack of fast rotators.
-
Runaway scenario: Fast rotators may have been dynamically ejected from the association core as surviving companions of supernova explosions. As a result, they could now reside beyond the central 1° region of Cygnus OB2, typically surveyed in most studies.
Our study highlights the need for continued investigation into the dynamics and rotational properties of the Cygnus OB2 massive star population. Although we have addressed classification inconsistencies and reduced some observational biases, the deficit of fast rotators remains unresolved. Further progress will require high-resolution, high S/N, and multi-epoch spectroscopy, extended beyond the central region of the association. Complementary kinematic surveys to identify potential runaway stars, along with a deeper characterization of binary properties (e.g. binary fraction) are also essential to fully understand the rotational velocity distribution of Cygnus OB2.
Acknowledgments
The authors acknowledge support funding from the Ministry of Science, Innovation and Universities (MCIU) through the Spanish State Research Agency (AEI) via grant PID2021-122397NB-C21 (cofunded by the European Regional Development Fund, FEDER) and the Severo Ochoa Program 2020-2023 (CEX2019-000920-S). SRB also thanks financial support from NextGeneration EU/PRTR and MIU (UNI/551/2021) through grant Margarita Salas-ULL. MAM project received support from the “La Caixa” Foundation (ID 100010434) under the fellowship code LCF/BQ/PI23/11970035. This work is partially based on observations made with the three following telescopes: (i) we thank the Nordic Optical Telescope, owned in collaboration by the University of Turku and Aarhus University, and operated jointly by Aarhus University, the University of Turku and the University of Oslo, representing Denmark, Finland and Norway, the University of Iceland and Stockholm University at the Observatorio del Roque de los Muchachos, La Palma, Spain, of the Instituto de Astrofisica de Canarias. The data presented in this work were obtained in part with ALFOSC, which is provided by the Instituto de Astrofisica de Andalucia (IAA) under a joint agreement with the University of Copenhagen and NOT; (ii) the Gran Telescopio Canarias is installed at the Spanish Observatorio del Roque de los Muchachos of the Instituto de Astrofísica de Canarias, on the island of La Palma. GTC data was obtained with the instrument OSIRIS, built by a Consortium led by the Instituto de Astrofísica de Canarias in collaboration with the Instituto de Astronomía of the Universidad Autónoma de México. OSIRIS was funded by GRANTECAN and the National Plan of Astronomy and Astrophysics of the Spanish Government; (iii) the Isaac Newton Telescope and its service mode are operated on the island of La Palma by the Isaac Newton Group of Telescopes in the Spanish Observatorio del Roque de los Muchachos of the Instituto de Astrofísica de Canarias. This work has made use of data from the European Space Agency (ESA) mission Gaia (https://www.cosmos.esa.int/gaia), processed by the Gaia Data Processing and Analysis Consortium (DPAC, https://www.cosmos.esa.int/web/gaia/dpac/consortium). Funding for the DPAC has been provided by national institutions, in particular the institutions participating in the Gaia Multilateral Agreement. During the spectroscopic data reduction we used PyRAF, a Python environment for IRAF. IRAF is distributed by the National Optical Astronomy Observatories, which is operated by the Association of Universities for Research in Astronomy, Inc. (AURA) under cooperative agreement with the National Science Foundation. In addition to the codes explicitly cited in the text, this paper makes use of the following packages: MATPLOTLIB (Hunter 2007), NUMPY (Harris et al. 2020), and SCIPY (Virtanen et al. 2020). We are deeply grateful to J. Maíz Apellániz for generously providing access to his private MGB library, which was essential in our spectral classification. Finally, we thank the anonymous referee for the constructive, useful and positive feedback, which has significantly contributed to the improvement of this paper.
References
- Abt, H. A., Levato, H., & Grosso, M. 2002, Rev. Mex. Astron. Astrofis. Conf. Ser., 14, 111 [Google Scholar]
- Anderson, T. W., & Darling, D. A. 1954, J. Am. Stat. Assoc., 49, 765 [Google Scholar]
- Bate, M. R. 2009a, MNRAS, 397, 232 [Google Scholar]
- Bate, M. R. 2009b, MNRAS, 392, 1363 [CrossRef] [Google Scholar]
- Bate, M. R., Bonnell, I. A., & Bromm, V. 2003, MNRAS, 339, 577 [NASA ADS] [CrossRef] [Google Scholar]
- Bate, M. R., Lodato, G., & Pringle, J. E. 2010, MNRAS, 401, 1505 [NASA ADS] [CrossRef] [Google Scholar]
- Berlanas, S. R., Herrero, A., Comerón, F., et al. 2018a, A&A, 620, A56 [NASA ADS] [CrossRef] [EDP Sciences] [Google Scholar]
- Berlanas, S. R., Herrero, A., Comerón, F., et al. 2018b, A&A, 612, A50 [NASA ADS] [CrossRef] [EDP Sciences] [Google Scholar]
- Berlanas, S. R., Wright, N. J., Herrero, A., Drew, J. E., & Lennon, D. J. 2019, MNRAS, 484, 1838 [NASA ADS] [Google Scholar]
- Berlanas, S. R., Herrero, A., Comerón, F., et al. 2020, A&A, 642, A168 [NASA ADS] [CrossRef] [EDP Sciences] [Google Scholar]
- Berlanas, S. R., Mahy, L., Herrero, A., et al. 2025, A&A, 695, A248 [NASA ADS] [CrossRef] [EDP Sciences] [Google Scholar]
- Britavskiy, N., Renzo, M., Nazé, Y., Rauw, G., & Vynatheya, P. 2024, A&A, 684, A35 [NASA ADS] [CrossRef] [EDP Sciences] [Google Scholar]
- Carroll, J. A. 1933, MNRAS, 93, 478 [NASA ADS] [CrossRef] [Google Scholar]
- Choudhury, S., Subramaniam, A., & Cole, A. A. 2016, MNRAS, 455, 1855 [NASA ADS] [CrossRef] [Google Scholar]
- Comerón, F., & Pasquali, A. 2012, A&A, 543, A101 [NASA ADS] [CrossRef] [EDP Sciences] [Google Scholar]
- Conti, P. S., & Ebbets, D. 1977, ApJ, 213, 438 [CrossRef] [Google Scholar]
- Corsaro, E., Lee, Y.-N., García, R. A., et al. 2017, Nat. Astron., 1, 0064 [NASA ADS] [CrossRef] [Google Scholar]
- de Mink, S. E., Langer, N., & Izzard, R. G. 2011, Bulletin de la Societe Royale des Sciences de Liege, 80, 543 [NASA ADS] [Google Scholar]
- de Mink, S. E., Langer, N., Izzard, R. G., Sana, H., & de Koter, A. 2013, ApJ, 764, 166 [Google Scholar]
- de Mink, S. E., Sana, H., Langer, N., Izzard, R. G., & Schneider, F. R. N. 2014, ApJ, 782, 7 [Google Scholar]
- Donati, J. F., & Landstreet, J. D. 2009, ARA&A, 47, 333 [Google Scholar]
- Dravins, D., Lindegren, L., & Torkelsson, U. 1990, A&A, 237, 137 [NASA ADS] [Google Scholar]
- Duez, V., & Mathis, S. 2010, A&A, 517, A58 [NASA ADS] [CrossRef] [EDP Sciences] [Google Scholar]
- Dufton, P. L., Evans, C. J., Hunter, I., Lennon, D. J., & Schneider, F. R. N. 2019, A&A, 626, A50 [NASA ADS] [CrossRef] [EDP Sciences] [Google Scholar]
- Ekström, S., Georgy, C., Eggenberger, P., et al. 2012, A&A, 537, A146 [Google Scholar]
- Gaia Collaboration (Prusti, T., et al.) 2016, A&A, 595, A1 [NASA ADS] [CrossRef] [EDP Sciences] [Google Scholar]
- Gaia Collaboration (Vallenari, A., et al.) 2023, A&A, 674, A1 [NASA ADS] [CrossRef] [EDP Sciences] [Google Scholar]
- Geen, S., Rosdahl, J., Blaizot, J., Devriendt, J., & Slyz, A. 2015, MNRAS, 448, 3248 [Google Scholar]
- Gray, D. F. 2008, The Observation and Analysis of Stellar Photospheres (Cambridge: Cambridge University Press) [Google Scholar]
- Griffiths, D. W., Goodwin, S. P., & Caballero-Nieves, S. M. 2018, MNRAS, 476, 2493 [Google Scholar]
- Grunhut, J. H., Wade, G. A., Sundqvist, J. O., et al. 2012, MNRAS, 426, 2208 [CrossRef] [Google Scholar]
- Harris, C. R., Millman, K. J., van der Walt, S. J., et al. 2020, Nature, 585, 357 [NASA ADS] [CrossRef] [Google Scholar]
- Herrero, A., Kudritzki, R. P., Vilchez, J. M., et al. 1992, A&A, 261, 209 [NASA ADS] [Google Scholar]
- Hodges, J. L. 1958, Arkiv for Matematik, 3, 469 [NASA ADS] [CrossRef] [Google Scholar]
- Høg, E., Fabricius, C., Makarov, V. V., et al. 2000, A&A, 355, L27 [Google Scholar]
- Holgado, G., Simón-Díaz, S., Herrero, A., & Barbá, R. H. 2022, A&A, 665, A150 [NASA ADS] [CrossRef] [EDP Sciences] [Google Scholar]
- Howarth, I. D., Siebert, K. W., Hussain, G. A. J., & Prinja, R. K. 1997, MNRAS, 284, 265 [NASA ADS] [CrossRef] [Google Scholar]
- Huang, W., Gies, D. R., & McSwain, M. V. 2010, ApJ, 722, 605 [Google Scholar]
- Hummel, W., Szeifert, T., Gässler, W., et al. 1999, A&A, 352, L31 [NASA ADS] [Google Scholar]
- Hunter, J. D. 2007, Comput. Sci. Eng., 9, 90 [NASA ADS] [CrossRef] [Google Scholar]
- Hunter, I., Dufton, P. L., Smartt, S. J., et al. 2007, A&A, 466, 277 [NASA ADS] [CrossRef] [EDP Sciences] [Google Scholar]
- Hunter, I., Lennon, D. J., Dufton, P. L., et al. 2008, A&A, 479, 541 [NASA ADS] [CrossRef] [EDP Sciences] [Google Scholar]
- Johnstone, D., Hollenbach, D., & Bally, J. 1998, ApJ, 499, 758 [NASA ADS] [CrossRef] [Google Scholar]
- Kiminki, D. C., Kobulnicky, H. A., Kinemuchi, K., et al. 2007, ApJ, 664, 1102 [NASA ADS] [CrossRef] [Google Scholar]
- Knödlseder, J. 2000, A&A, 360, 539 [NASA ADS] [Google Scholar]
- Koenigl, A. 1991, ApJ, 370, L39 [Google Scholar]
- Kushary, D. 2000, Technometrics, 42, 216 [Google Scholar]
- Langer, N. 2012, ARA&A, 50, 107 [CrossRef] [Google Scholar]
- Li, L., Zhu, C., Guo, S., Liu, H., & Lü, G. 2023, ApJ, 952, 79 [Google Scholar]
- Lin, M.-K., Krumholz, M. R., & Kratter, K. M. 2011, MNRAS, 416, 580 [NASA ADS] [Google Scholar]
- Long, M., Romanova, M. M., & Lovelace, R. V. E. 2005, ApJ, 634, 1214 [Google Scholar]
- Maeder, A., & Meynet, G. 2000, ARA&A, 38, 143 [Google Scholar]
- Maíz Apellániz, J., Alfaro, E. J., Arias, J. I., et al. 2015, in Highlights of Spanish Astrophysics VIII, eds. A. J. Cenarro, F. Figueras, C. Hernández-Monteagudo, J. Trujillo Bueno, & L. Valdivielso, 603 [Google Scholar]
- Maíz Apellániz, J., Sota, A., Arias, J. I., et al. 2016, ApJS, 224, 4 [CrossRef] [Google Scholar]
- Markova, N., Puls, J., Scuderi, S., Simón-Díaz, S., & Herrero, A. 2011, A&A, 530, A11 [NASA ADS] [CrossRef] [EDP Sciences] [Google Scholar]
- Mashreghi, Z., Haziza, D., & Léger, C. 2016, Stat. Surv., 10, 1 [Google Scholar]
- Mason, B. D., Hartkopf, W. I., Gies, D. R., Henry, T. J., & Helsel, J. W. 2009, AJ, 137, 3358 [Google Scholar]
- Massey, P., & Thompson, A. B. 1991, AJ, 101, 1408 [NASA ADS] [CrossRef] [Google Scholar]
- Matt, S., & Pudritz, R. E. 2005, MNRAS, 356, 167 [NASA ADS] [CrossRef] [Google Scholar]
- McKee, C. F., & Tan, J. C. 2003, ApJ, 585, 850 [Google Scholar]
- Mokiem, M. R., de Koter, A., Evans, C. J., et al. 2006, A&A, 456, 1131 [NASA ADS] [CrossRef] [EDP Sciences] [Google Scholar]
- Monet, D. G., Levine, S. E., Canzian, B., et al. 2003, AJ, 125, 984 [Google Scholar]
- Mouschovias, T. C. 1998, APS April Meeting Abstracts, APS Meeting Abstracts, I8.01 [Google Scholar]
- Nazé, Y., Britavskiy, N., & Labadie-Bartz, J. 2024, A&A, 689, A320 [NASA ADS] [CrossRef] [EDP Sciences] [Google Scholar]
- Negueruela, I., Marco, A., Herrero, A., & Clark, J. S. 2008, A&A, 487, 575 [NASA ADS] [CrossRef] [EDP Sciences] [Google Scholar]
- Oey, M. S., & Clarke, C. J. 2009, in Massive Stars: From Pop III and GRBs to the Milky Way. Space Telescope Science Institute Symposium Series No. 20, eds. M. Livio, & E. Villaver, 74 [Google Scholar]
- Offner, S. S. R., Moe, M., Kratter, K. M., et al. 2023, ASP Conf. Ser., 534, 275 [NASA ADS] [Google Scholar]
- Panagia, N. 2005, in IAU Colloquium 192: Cosmic Explosions, On the 10th Anniversary of SN1993J, eds. J. M. Marcaide, & K. W. Weiler, 99, 585 [Google Scholar]
- Penny, L. R. 1996, ApJ, 463, 737 [Google Scholar]
- Peres, I., Sabach, E., & Soker, N. 2019, MNRAS, 486, 1652 [Google Scholar]
- Pfalzner, S., Olczak, C., & Eckart, A. 2006, A&A, 454, 811 [NASA ADS] [CrossRef] [EDP Sciences] [Google Scholar]
- Prochaska, J., Hennawi, J., Westfall, K., et al. 2020a, J. Open Source Softw., 5, 2308 [NASA ADS] [CrossRef] [Google Scholar]
- Prochaska, J. X., Hennawi, J., Cooke, R., et al. 2020b, https://doi.org/10.5281/zenodo.3743493 [Google Scholar]
- Ramírez-Agudelo, O. H., Simón-Díaz, S., Sana, H., et al. 2013, A&A, 560, A29 [NASA ADS] [CrossRef] [EDP Sciences] [Google Scholar]
- Ramírez-Agudelo, O. H., Sana, H., de Mink, S. E., et al. 2015, A&A, 580, A92 [NASA ADS] [CrossRef] [EDP Sciences] [Google Scholar]
- Rebolledo, D., Guzmán, A. E., Contreras, Y., et al. 2020, ApJ, 891, 113 [Google Scholar]
- Reed, B. C. 2003, AJ, 125, 2531 [NASA ADS] [CrossRef] [Google Scholar]
- Riello, M., De Angeli, F., Evans, D. W., et al. 2021, A&A, 649, A3 [NASA ADS] [CrossRef] [EDP Sciences] [Google Scholar]
- Rosen, A. L., Krumholz, M. R., & Ramirez-Ruiz, E. 2012, ApJ, 748, 97 [NASA ADS] [CrossRef] [Google Scholar]
- Ryans, R. S. I., Dufton, P. L., Rolleston, W. R. J., et al. 2002, MNRAS, 336, 577 [Google Scholar]
- Sana, H., Momany, Y., Gieles, M., et al. 2010, A&A, 515, A26 [NASA ADS] [CrossRef] [EDP Sciences] [Google Scholar]
- Sana, H., de Mink, S. E., de Koter, A., et al. 2012, Science, 337, 444 [Google Scholar]
- Sana, H., Le Bouquin, J. B., Lacour, S., et al. 2014, ApJS, 215, 15 [Google Scholar]
- Sana, H., Ramírez-Agudelo, O. H., Hénault-Brunet, V., et al. 2022, A&A, 668, L5 [NASA ADS] [CrossRef] [EDP Sciences] [Google Scholar]
- Sana, H., Shenar, T., Bodensteiner, J., et al. 2025, Nat. Astron., 9, 1337 [Google Scholar]
- Schneider, F. R. N., Ramírez-Agudelo, O. H., Tramper, F., et al. 2018, A&A, 618, A73 [NASA ADS] [CrossRef] [EDP Sciences] [Google Scholar]
- Schneider, F. R. N., Ohlmann, S. T., Podsiadlowski, P., et al. 2019, Nature, 574, 211 [Google Scholar]
- Scholz, F. W., & Stephens, M. A. 1987, J. Am. Stat. Assoc., 82, 918 [Google Scholar]
- Science Software Branch at STScI 2012, Astrophysics Source Code Library [record ascl:1207.011] [Google Scholar]
- Shen, Y., & Lou, Y.-Q. 2006, MNRAS, 370, L85 [Google Scholar]
- Shu, F., Najita, J., Ostriker, E., et al. 1994, ApJ, 429, 781 [Google Scholar]
- Simón-Díaz, S., & Herrero, A. 2007, A&A, 468, 1063 [NASA ADS] [CrossRef] [EDP Sciences] [Google Scholar]
- Simón-Díaz, S., & Herrero, A. 2014, A&A, 562, A135 [NASA ADS] [CrossRef] [EDP Sciences] [Google Scholar]
- Slettebak, A., Collins, G. W., II, Boyce, P. B., White, N. M., & Parkinson, T. D. 1975, ApJS, 29, 137 [NASA ADS] [CrossRef] [Google Scholar]
- Smith, M. A., & Gray, D. F. 1976, PASP, 88, 809 [Google Scholar]
- Sota, A., Maíz Apellániz, J., Walborn, N. R., et al. 2011, ApJS, 193, 24 [Google Scholar]
- Sota, A., Maíz Apellániz, J., Morrell, N. I., et al. 2014, ApJS, 211, 10 [Google Scholar]
- Spruit, H. C. 1999, A&A, 349, 189 [NASA ADS] [Google Scholar]
- Strom, S. E., Wolff, S. C., & Dror, D. H. A. 2005, AJ, 129, 809 [Google Scholar]
- Tokovinin, A., & Moe, M. 2020, MNRAS, 491, 5158 [NASA ADS] [CrossRef] [Google Scholar]
- Trundle, C., Dufton, P. L., Hunter, I., et al. 2007, A&A, 471, 625 [NASA ADS] [CrossRef] [EDP Sciences] [Google Scholar]
- Virtanen, P., Gommers, R., Oliphant, T. E., et al. 2020, Nat. Med., 17, 261 [Google Scholar]
- Weidner, C., & Kroupa, P. 2006, MNRAS, 365, 1333 [Google Scholar]
- Wolff, S. C., Strom, S. E., Dror, D., & Venn, K. 2007, AJ, 133, 1092 [Google Scholar]
- Wright, N. J., Parker, R. J., Goodwin, S. P., & Drake, J. J. 2014, MNRAS, 438, 639 [Google Scholar]
- Wright, N. J., Drew, J. E., & Mohr-Smith, M. 2015, MNRAS, 449, 741 [NASA ADS] [CrossRef] [Google Scholar]
- Wright, N. J., Kounkel, M., Zari, E., Goodwin, S., & Jeffries, R. D. 2023, ASP Conf. Ser., 534, 129 [Google Scholar]
- Zacharias, N., Finch, C. T., Girard, T. M., et al. 2012, VizieR Online Data Catalog: I/322A [Google Scholar]
For this work we only consider the O population of NGC 346.
Appendix A: Initial sample of B0-type stars in Cygnus OB2
Identifications, J2016.0 coordinates, G and B magnitudes, along with the GBP − GRP color index of the initial B0 sample from Cygnus OB2.
Appendix B: Updated spectral types and projected rotational velocities of the initial B0-type sample
New spectral types (SpT) and projected rotational velocities (v sin i) for our sample of initial B0 stars.
Appendix C: Revising the spectral type of 2MASS J20295701+4109538
2MASS J20295701+4109538 was previously classified as B0 V by Comerón & Pasquali (2012). However, a detailed inspection of its optical spectrum reveals features more consistent with a late O-type classification. As shown in Fig. C.1, the helium and silicon diagnostic lines provide clear evidence supporting this revision.
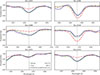 |
Fig. C.1. Reclassification of 2MASS J20295701+4109538 from B0 to O9.5. The target spectrum, obtained with OSIRIS+@GTC at R ∼ 2500, is shown in dark blue. Each panel displays the diagnostic lines used to distinguish O- and early B-type stars, following the criteria of Sota et al. (2011). For comparison, the O- and B-type spectra from the GOSSS catalog (Maíz Apellániz et al. 2016) are included: the O9.5 V standard AE Aur (in green) and the B0 V standard τ Sco (in red). |
The He II absorption lines at 4542 Å and 4200 Å are clearly present, although weaker than the He I lines at 4388 Å and 4144 Å. This relative line strength pattern is characteristic of late-O and early-B stars, according to Sota et al. (2011). However, a B0 star would show substantially weaker He II lines compared to He I (see Table C.1). Moreover, the Si III λ4552 line appears weak with respect to He II λ4542, indicating an O-type rather than early-B classification.
Classification criteria for spectral types at the O9.5-B0 range (Sota et al. 2011).
We performed the spectral classification by comparing the observed spectrum of 2MASS J20295701+4109538 (OSIRIS+@GTC, R ∼ 2500) with standard spectra using the MGB code. This tool enables a direct comparison of diagnostic line ratios to identify the best-matching standard star, ensuring an accurate determination of the spectral type. This analysis utilizes O-type standards from the GOSSS catalog (Maíz Apellániz et al. 2016) and a dedicated collection of B0 standard spectra. As shown in Fig. C.1, the observed spectrum of 2MASS J20295701+4109538 closely matches the O9.5 V standard AE Aur, while differing markedly from the B0 V standard τ Sco (plotted in dark blue, green and red, respectively). The difference is especially clear in the strength of the He II features and in the Si III λ4552 line. Together, these diagnostics confirm that 2MASS J20295701+4109538 should be reclassified as O9.5.
This misclassification by Comerón & Pasquali (2012) was likely caused by the relatively low spectral resolution and limited signal-to-noise ratio of the data. Their spectra, with a resolving power of R ∼ 1000, make it challenging to detect subtle variations in key diagnostic lines. This is particularly important when distinguishing between late-O9 and B0 spectral types: differences in line strengths and profiles are minimal and can be easily masked by noise or instrumental broadening. In these cases, even small inaccuracies in line measurement can lead to misclassification.
This example highlights the advantages of using the interactive features of MGB. With this tool users can closely examine line profiles and ratios, and compare multiple diagnostic lines simultaneously. When combined with high-quality data – spectra with sufficient signal-to-noise and resolution – this approach significantly improves the precision of spectral classification, critical in the transition between late-O and early B-type stars.
Appendix D: Comparative analysis of projected rotational velocity distributions via the Anderson-Darling k-sample test
To check if the rotational velocities of Cygnus OB2 statistically follow the same distribution as those in reference studies, we applied the Anderson-Darling k-sample test (AD, see Anderson & Darling 1954; Scholz & Stephens 1987). The AD test was intentionally chosen over the commonly used Kolmogorov-Smirnov two-sided test (KS, Hodges 1958): while the KS test is more sensitive to differences at the center of the distribution, the AD test emphasizes the tails – a critical advantage given our focus on the high-velocity region. Additionally, the AD test shows greater sensitivity than the KS test when dealing with small samples, making it particularly well-suited for our Cygnus OB2 distribution.
The results of the AD test, summarized in Table D.1, show statistically significant differences between the v sin i distributions of Cygnus OB2 and other reference environments. The strongest contrast is found with the Galactic sample (Holgado et al. 2022), both for the full dataset and for stars with M < 32 M⊙. These cases yield the highest test statistics and lowest p-values, strongly rejecting the null hypothesis of a shared parent distribution. Similarly, the 30 Doradus (Ramírez-Agudelo et al. 2013) and Carina OB1 (Berlanas et al. 2025) samples show statistical differences with p-values below 0.02 and 0.01, respectively. In contrast, the NGC 346 distribution (Dufton et al. 2019) yields a marginal p-value of 0.05, suggesting only weak evidence against the null hypothesis. Overall, these AD results indicate that the Cygnus OB2 rotational velocity distribution is statistically distinct from the other studied massive star environments.
Test statistics and p-values from the Anderson–Darling k-sample test.
Appendix E: Statistical inference of projected rotational velocity distributions via bootstrap analysis
In Sect. 4.2, we present the distributions of projected rotational velocities (v sin i) for O-type stars across several Galactic and extragalactic regions. Fig. 4 compares the v sin i distribution of Cygnus OB2 (shown in black) with four reference populations: the Galactic sample (top left, Holgado et al. 2022), the 30 Doradus population (top right, Ramírez-Agudelo et al. 2013), Carina OB1 (bottom left, Berlanas et al. 2025), and NGC 346 (bottom right, Dufton et al. 2019). In each case, the upper subplot displays the normalized histogram, while the lower subplot shows the corresponding cumulative distribution function.
As previously discussed, significant differences are observed between stellar populations, especially in the high-velocity region (v sin i ≳ 200 km s−1). Some populations exhibit a higher fraction of rapid rotators, as the Milky Way and 30 Doradus (see Table E.1). These variations may reflect differences in evolutionary state, properties related to the molecular cloud (e.g., multiplicity fraction or initial rotational distribution), or dynamical mechanisms such as runaway ejections. While alternative explanations can be considered, we consider them less pausible; these include biased v sin i arising from spin-axis alignment and reduced rotation due to magnetic braking (see Sect. 5 for a detailed discussion).
Number of O-type stars with measured projected rotational velocities in each stellar sample.
To verify that the observed differences in the high-velocity region are not artifacts of binning or differences in sample size, we perform an intensive bootstrap analysis (Kushary 2000; Mashreghi et al. 2016). This non-parametric method enables statistically robust comparisons: it reduces the impact of small-number statistics and provides reliable uncertainties for each velocity bin, without assuming any underlying distribution. For each population, we randomly select subsamples of 40 stars – with replacement – from the original dataset; with this subsample size we ensure an unbiased and consistent comparison across all regions (see Table E.1). Each bootstrap iteration generates a synthetic sample, with its v sin i values organized into fixed-width bins of 20 km s−1. This procedure is repeated 104 times to achieve high statistical precision, and final histograms are derived by averaging the binned counts of all iterations. The corresponding standard deviation provides a robust, data-driven estimate of the uncertainty in each bin.
The resulting v sin i distributions for O-type stars are presented in Fig. E.1, following the same format as Fig. 4. Bootstrapped uncertainties, shown as error bars, provide direct estimates of statistical errors in the normalized histograms and cumulative distributions. Crucially, the bootstrapped distributions closely match the original histograms, reinforcing the statistical robustness of the observed features. In Cygnus OB2, this agreement confirms that the lack of fast rotators is not a consequence of binning artifacts or statistical fluctuations. Instead, the bootstrap analysis reveals a significant and persistent deficit of fast-rotating stars, suggesting that the absence of a high-velocity tail is intrinsic to the sample. While this result is statistically robust, it may still be affected by observational biases, particularly due to the limited spatial coverage of the Cygnus OB2 sample.
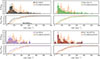 |
Fig. E.1. Bootstrapped distribution of projected rotational velocities for O-type stars across different regions within the local Universe. The histograms in black, green, purple, and brown show the v sin i measurements for Galactic stars in the solar neighborhood (Holgado et al. 2022), 30 Doradus (Ramírez-Agudelo et al. 2013), Carina OB1 (Berlanas et al. 2025), and NGC 346 (Dufton et al. 2019), respectively. The orange histogram represents the rotational velocity distribution for Cygnus OB2, incorporating O-type stars from Berlanas et al. (2020) alongside those recently reclassified from the B0 sample. The error bars reflect the standard deviation in each velocity bin obtained from the bootstrap analysis. |
All Tables
Diagnostic spectral lines used in iacob-broad to compute the projected rotational velocities (v sin i).
Identifications, J2016.0 coordinates, G and B magnitudes, along with the GBP − GRP color index of the initial B0 sample from Cygnus OB2.
New spectral types (SpT) and projected rotational velocities (v sin i) for our sample of initial B0 stars.
Classification criteria for spectral types at the O9.5-B0 range (Sota et al. 2011).
Number of O-type stars with measured projected rotational velocities in each stellar sample.
All Figures
|
Fig. 1. Comparison of projected rotational velocities resulting from iacob-broad, using the Fourier transform (FT) and the goodness-of-fit (GOF) methods. The dashed lines indicate deviations of 20 km s−1 or 20% (whichever is the largest) from the 1:1 correlation. The gray-shaded square denotes rotational velocities below the c/R threshold, estimated for a spectral resolution of R = 5000. The green squares show those v sin i in which GOF(vmac) = 0 is used. |
| In the text | |
|
Fig. 2. Computed projected rotational velocities for the star sample in this work. Different shades of blue represent the corresponding spectral types (O- or B-type) after our spectral reclassification. |
| In the text | |
|
Fig. 3. Projected rotational velocities for the O-type population in Cygnus OB2. Left: histogram representing all v sin i values for the Cygnus OB2 O-type stars (in orange), combining results from this study with those from Berlanas et al. (2020). The rotational velocities computed in this work for O stars are plotted in blue. Middle: v sin i data for O-type stars with spectroscopic masses M < 32 M⊙ (in violet, Berlanas et al. 2020). Right: v sin i results from Holgado et al. (2022) for Galactic O-type stars with M < 32 M⊙ (gray histogram). The cyan overlay merges the blue and violet histograms from the middle panel. |
| In the text | |
|
Fig. 4. Distribution of projected rotational velocities for O-type stars v sin i across different regions of the local Universe. The histograms in black, green, purple, and brown represent the v sin i measurements for Galactic stars in the solar neighborhood (Holgado et al. 2022), 30 Doradus (Ramírez-Agudelo et al. 2013), Carina OB1 (Berlanas et al. 2025), and NGC 346 (Dufton et al. 2019), respectively. The orange histogram displays the rotational velocity distribution for Cygnus OB2, integrating O-type stars from Berlanas et al. (2020) with those newly identified in our reclassification of the B0 sample. |
| In the text | |
|
Fig. 5. Projected rotational velocities from the O+B0 population of Cygnus OB2 (shown in pink), compared with the v sin i distribution of Galactic O stars (in black, Holgado et al. 2022). The Cygnus OB2 distribution contains results obtained by Berlanas et al. (2020) (O-type stars) and all the v sin i computed in this work (new O and B0 stars). |
| In the text | |
|
Fig. 6. Schematic evolutionary paths of a massive binary system. Initially, if the two stars orbit close enough to each other, they may eventually merge, forming a single, more massive star (top path). Alternatively, the more massive star may explode as a supernova (SN), potentially ejecting the companion as a high-velocity runaway star or resulting in a system with a compact object. The companion may later undergo its own SN event, creating a double compact-object system that could eventually merge and emit gravitational waves (bottom paths). |
| In the text | |
|
Fig. 7. MSX 8 μm image showing the spatial distribution of the O-type stars from Cygnus OB2 analyzed by Berlanas et al. (2020) (orange circles) and those identified in this work (pink triangles). The B0 population is plotted with squares in gray. For reference, the red star locates CygOB2 #8A, with J2016.0 coordinates RA = 20:33:15.078 and Dec = +41:18:50.479. The dashed circle defines a 1° radius region, centered on Galactic coordinates l = 79.8° and b = +0.8° (Knödlseder 2000). North is up, and east is to the left. |
| In the text | |
|
Fig. C.1. Reclassification of 2MASS J20295701+4109538 from B0 to O9.5. The target spectrum, obtained with OSIRIS+@GTC at R ∼ 2500, is shown in dark blue. Each panel displays the diagnostic lines used to distinguish O- and early B-type stars, following the criteria of Sota et al. (2011). For comparison, the O- and B-type spectra from the GOSSS catalog (Maíz Apellániz et al. 2016) are included: the O9.5 V standard AE Aur (in green) and the B0 V standard τ Sco (in red). |
| In the text | |
|
Fig. E.1. Bootstrapped distribution of projected rotational velocities for O-type stars across different regions within the local Universe. The histograms in black, green, purple, and brown show the v sin i measurements for Galactic stars in the solar neighborhood (Holgado et al. 2022), 30 Doradus (Ramírez-Agudelo et al. 2013), Carina OB1 (Berlanas et al. 2025), and NGC 346 (Dufton et al. 2019), respectively. The orange histogram represents the rotational velocity distribution for Cygnus OB2, incorporating O-type stars from Berlanas et al. (2020) alongside those recently reclassified from the B0 sample. The error bars reflect the standard deviation in each velocity bin obtained from the bootstrap analysis. |
| In the text | |
Current usage metrics show cumulative count of Article Views (full-text article views including HTML views, PDF and ePub downloads, according to the available data) and Abstracts Views on Vision4Press platform.
Data correspond to usage on the plateform after 2015. The current usage metrics is available 48-96 hours after online publication and is updated daily on week days.
Initial download of the metrics may take a while.