Fig. 1.
Download original image
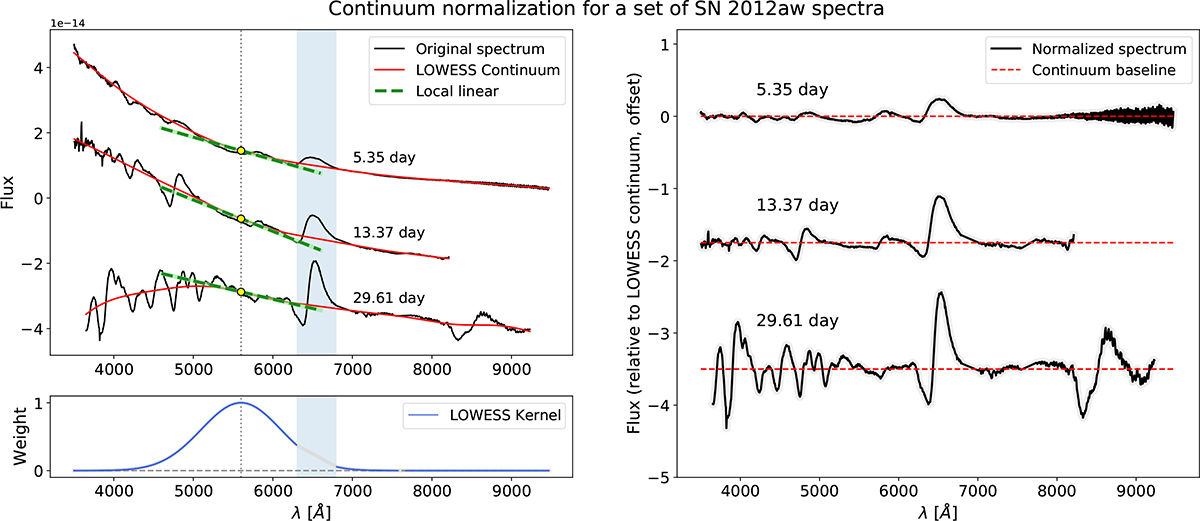
Example of the LOWESS-based continuum removal applied to selected spectra of SN 2012aw. Top left: Original spectra with the LOWESS-smoothed continuum overplotted. The yellow marker indicates a reference wavelength at which the local linear fits are displayed for each spectrum. The blue shaded region highlights the masked Hα feature, excluded from the continuum fitting to avoid bias Bottom left: Shape of the LOWESS kernel at the reference wavelength, illustrating the weighting scheme used during smoothing. Right: Continuum-normalized spectra obtained by dividing the original data by the LOWESS continuum fit.
Current usage metrics show cumulative count of Article Views (full-text article views including HTML views, PDF and ePub downloads, according to the available data) and Abstracts Views on Vision4Press platform.
Data correspond to usage on the plateform after 2015. The current usage metrics is available 48-96 hours after online publication and is updated daily on week days.
Initial download of the metrics may take a while.