Open Access
Fig. A.2.
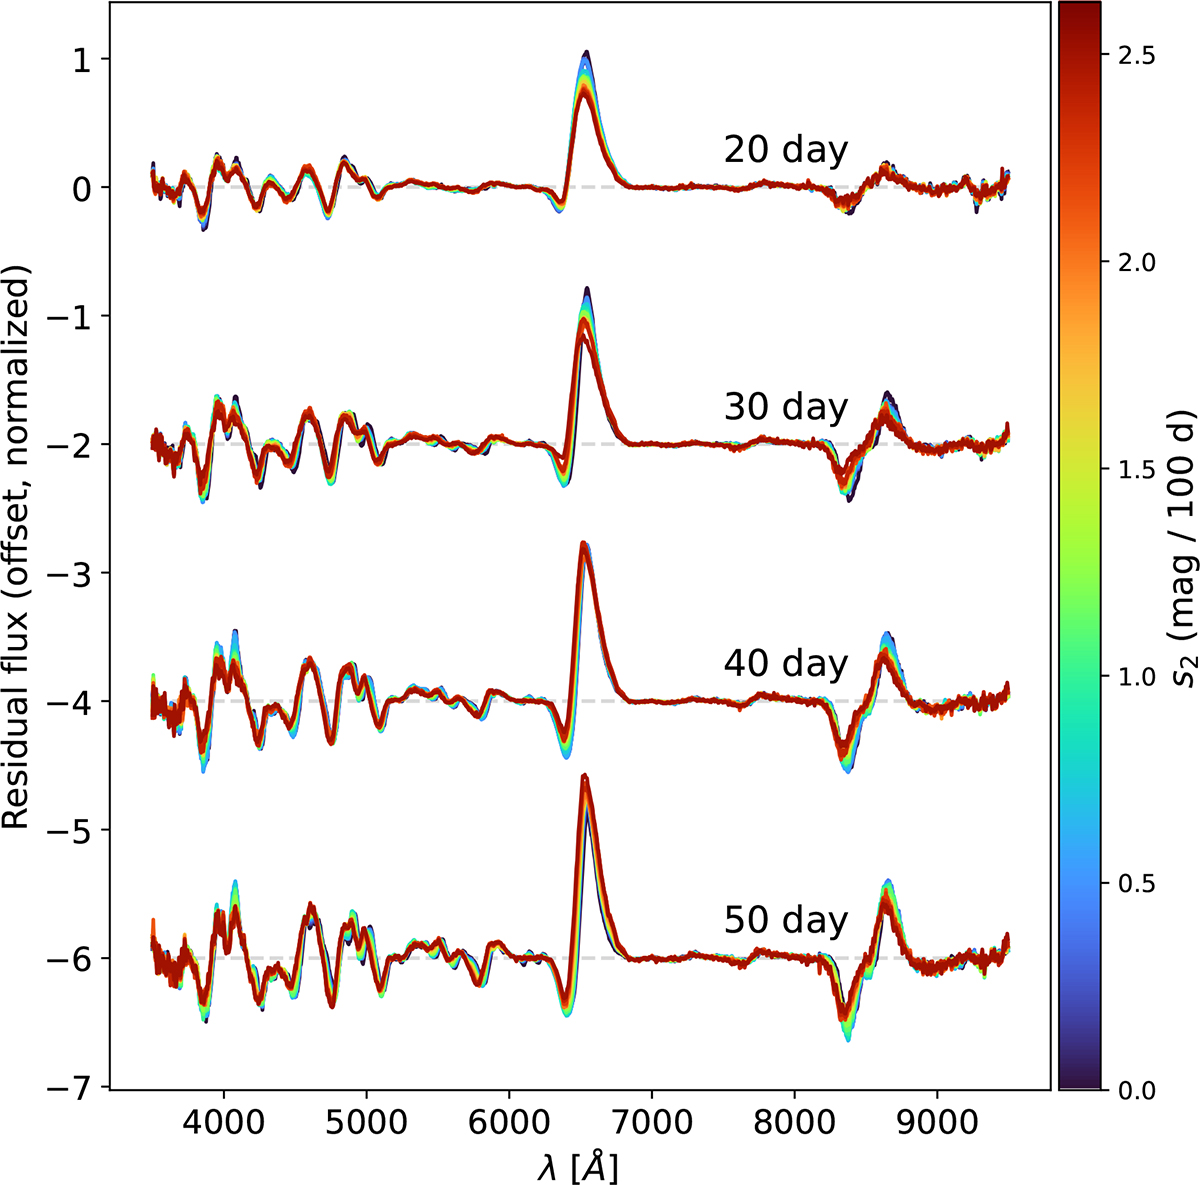
Download original image
Recovered spectral features along changes in the light curve decline rate without the use of prior denoising on the spectra. The change in the features along the light curve decline rates matches that presented in Fig. 8: for more significant decline rates, one finds more suppressed emission and absorption lines.
Current usage metrics show cumulative count of Article Views (full-text article views including HTML views, PDF and ePub downloads, according to the available data) and Abstracts Views on Vision4Press platform.
Data correspond to usage on the plateform after 2015. The current usage metrics is available 48-96 hours after online publication and is updated daily on week days.
Initial download of the metrics may take a while.