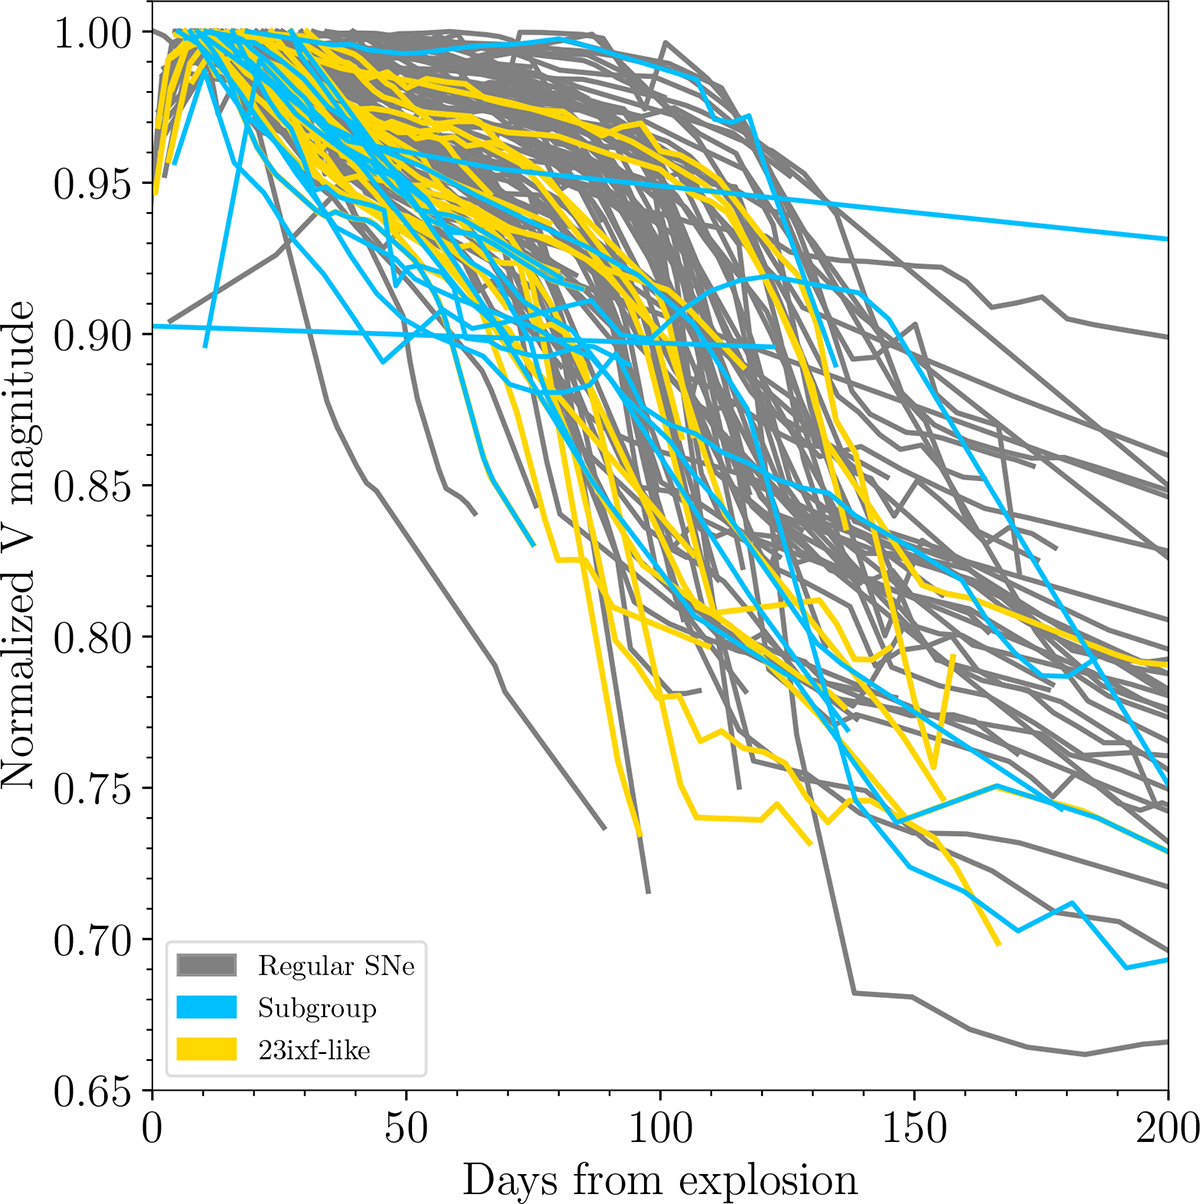
Fig. E.1.
Download original image
V-band light curves of our sample objects. The gray curves correspond to the "continuous" sample, the blue curves to the subgroup objects, and the yellow curves to the objects that are similar to 2023ixf in their spectral appearance. The light curves have been normalized to their peak or maximum observed brightness to better visualize differences.
Current usage metrics show cumulative count of Article Views (full-text article views including HTML views, PDF and ePub downloads, according to the available data) and Abstracts Views on Vision4Press platform.
Data correspond to usage on the plateform after 2015. The current usage metrics is available 48-96 hours after online publication and is updated daily on week days.
Initial download of the metrics may take a while.