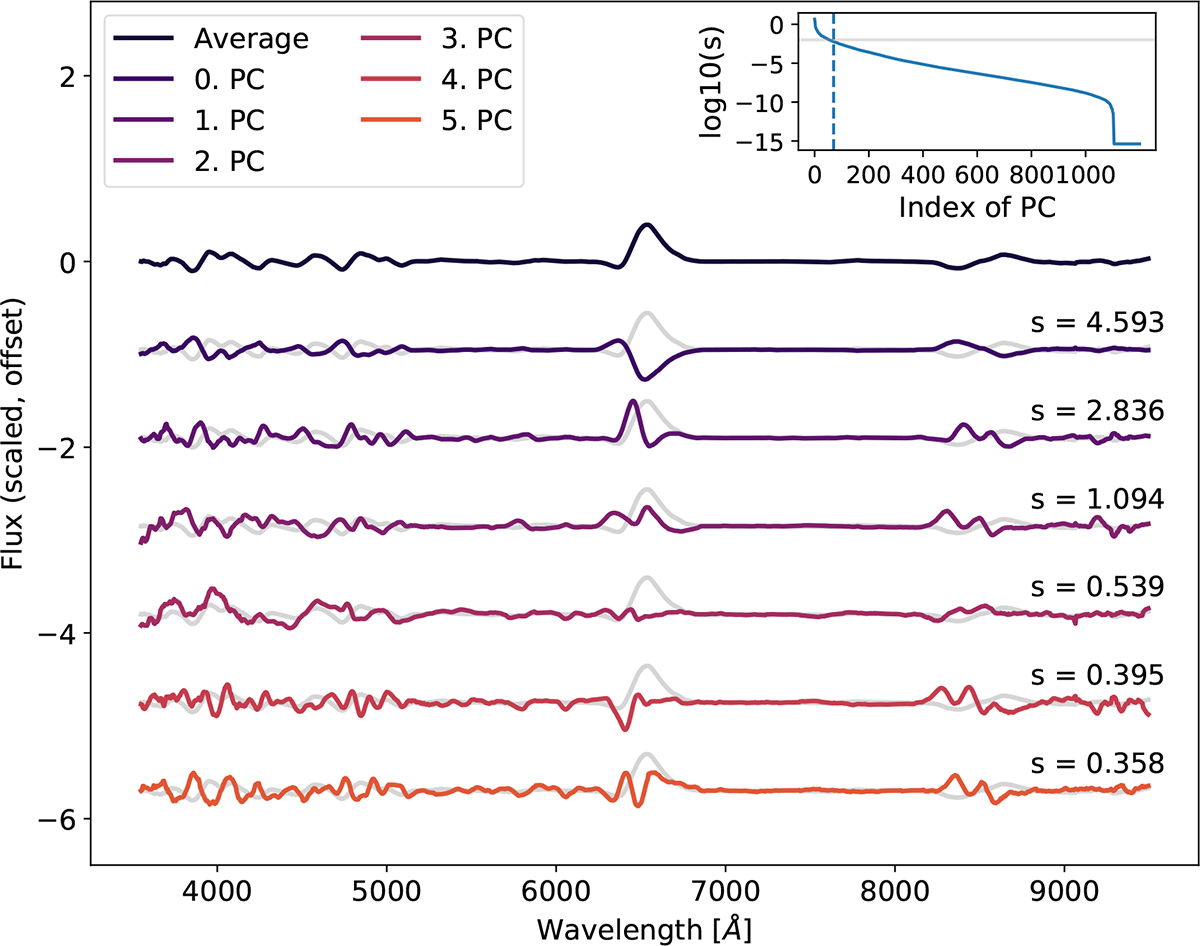
Fig. 4.
Download original image
PCA results at one representative epoch. The figure shows the PCA applied to continuum-normalized spectra at 20 days post-explosion. The top spectrum represents the mean SN II spectrum at that epoch, while the spectra below show the first few eigenspectra derived from the PCS (via singular value decomposition, SVD), ordered from top to bottom by decreasing significance. For reference, the mean spectrum is overplotted in light gray behind each eigenspectrum. The numbers next to each eigenspectrum indicate the corresponding eigenvalue, which reflects the variance explained by that PC. The inset plot in each panel displays the eigenvalue decay, indicating the variance captured by each component.
Current usage metrics show cumulative count of Article Views (full-text article views including HTML views, PDF and ePub downloads, according to the available data) and Abstracts Views on Vision4Press platform.
Data correspond to usage on the plateform after 2015. The current usage metrics is available 48-96 hours after online publication and is updated daily on week days.
Initial download of the metrics may take a while.