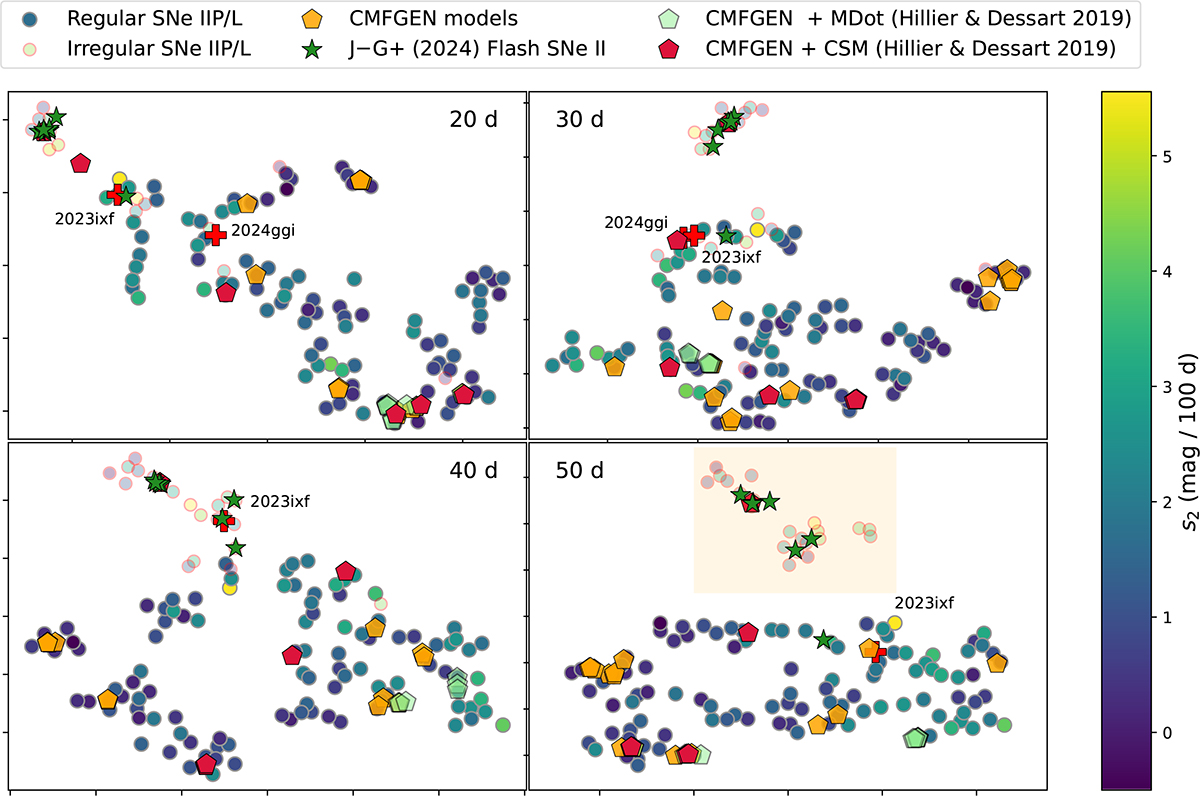
Fig. 5.
Download original image
t-SNE projection plots of the PCA coefficients (per epoch). These plots show how the SNe are distributed within the high-dimensional PCA space after dimensional reduction. Colored pentagons mark the positions of different CMFGEN models variants. SNe 2023ixf and 2024ggi are also added using the spectra currently available in the literature (red crosses), along with CSM-interacting SNe II from Jacobson-Galán et al. (2024) (green stars). A clear separation by s2 values is observed across all epochs, confirming the link between spectral and light curve properties. At 50 days, two groups emerge: a continuous “regular SNe IIP/L” sequence along s2, and a scattered subgroup, likely shaped by strong CSM interaction (marked by the yellow rectangle). Model projections align with expectations: CSM-rich models explain the subgroup objects, while mass-loss models resemble fast-declining SNe.
Current usage metrics show cumulative count of Article Views (full-text article views including HTML views, PDF and ePub downloads, according to the available data) and Abstracts Views on Vision4Press platform.
Data correspond to usage on the plateform after 2015. The current usage metrics is available 48-96 hours after online publication and is updated daily on week days.
Initial download of the metrics may take a while.