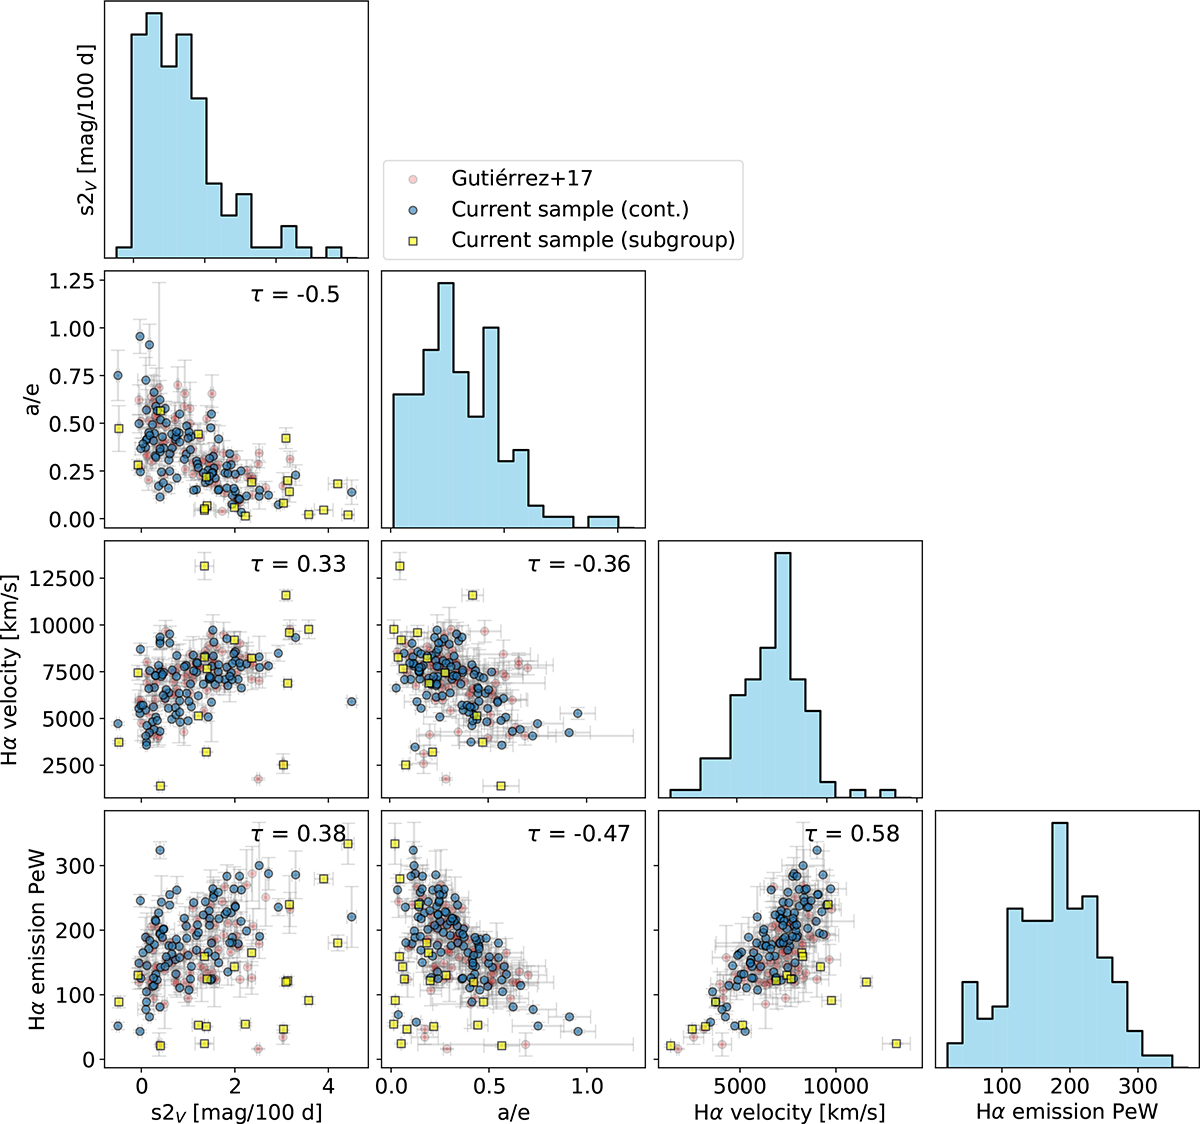
Fig. 7.
Download original image
Cornerplot of the measured spectral and light curve parameters for our supernova sample (blue and yellow squares together) at the epoch of 50 days. The blue circles represent the supernovae that belong to the “continuous” subclass of SNe II, while the yellow squares are the objects that are members of the detached subgroup based on their spectral appearance and the clustering performed in Sect. 4.3. The red circles represent the measurements done in Gutiérrez et al. (2017b), for comparison. The τ values are the Kendall-tau correlation parameters for the canonical SNe.
Current usage metrics show cumulative count of Article Views (full-text article views including HTML views, PDF and ePub downloads, according to the available data) and Abstracts Views on Vision4Press platform.
Data correspond to usage on the plateform after 2015. The current usage metrics is available 48-96 hours after online publication and is updated daily on week days.
Initial download of the metrics may take a while.