Fig. 8.
Download original image
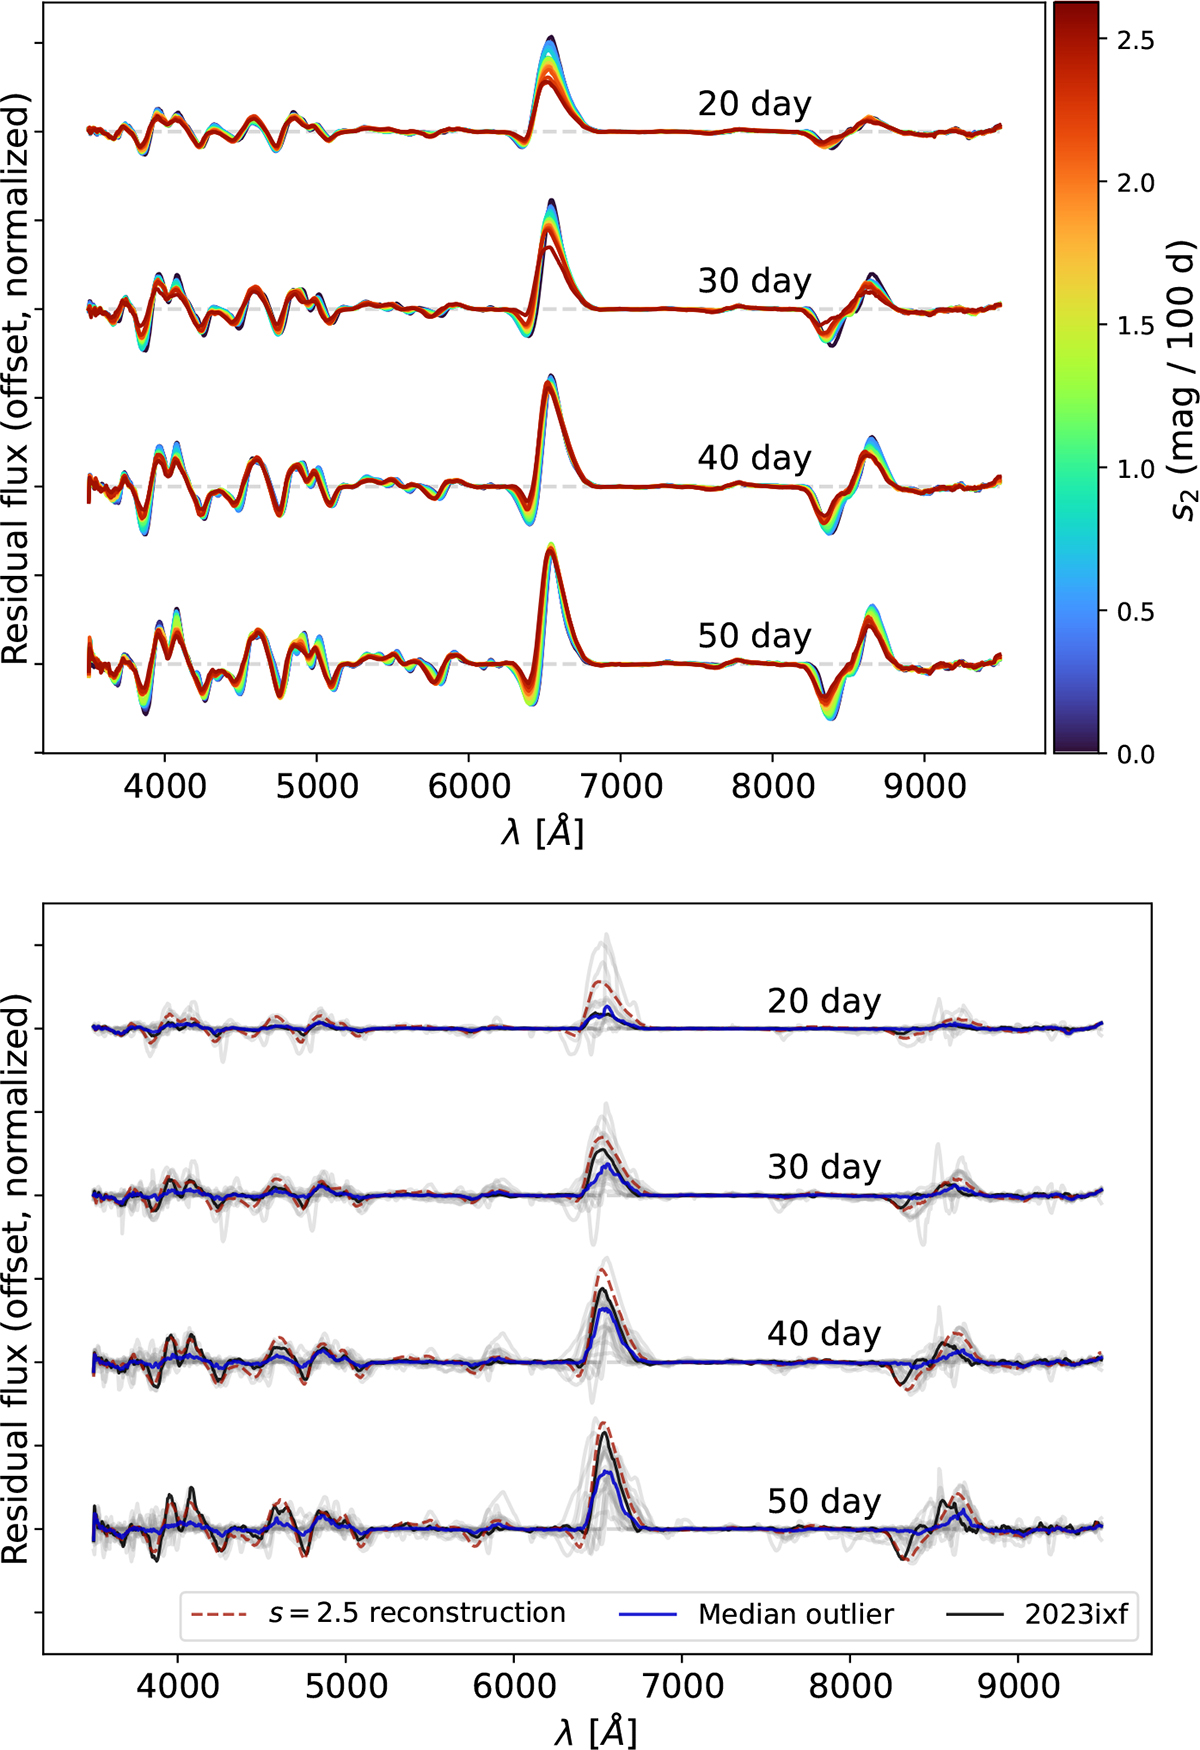
Top: Median reconstructed spectral trends as a function of the s2 light curve decline rate based on our PCA analysis. The four sets of spectra correspond to the four investigated epochs. The color of the individual spectra shows the s2 light curve decline rate for which they were calculated. Bottom: Subgroup spectra. The gray spectra show those of the subgroup objects (defined by Fig. 5, the blue spectra show their median for each epoch. The red dashed spectrum shows the reconstructed spectrum for s = 2.5 [mag/100 d] (which is the darkest red spectrum on the left-hand side plot), while the black curve shows the spectra of SN 2023ixf.
Current usage metrics show cumulative count of Article Views (full-text article views including HTML views, PDF and ePub downloads, according to the available data) and Abstracts Views on Vision4Press platform.
Data correspond to usage on the plateform after 2015. The current usage metrics is available 48-96 hours after online publication and is updated daily on week days.
Initial download of the metrics may take a while.