| Issue |
A&A
Volume 708, April 2026
|
|
|---|---|---|
| Article Number | L10 | |
| Number of page(s) | 8 | |
| Section | Letters to the Editor | |
| DOI | https://doi.org/10.1051/0004-6361/202557485 | |
| Published online | 09 April 2026 | |
Letter to the Editor
Space debris contributions to night sky brightness
Comparing model predictions and implications for astronomical signal-to-noise ratios
1
ICA, Slovak Academy of Sciences, 845 03 Bratislava, Slovakia
2
Department of Astrophysics, University of Vienna, 1180 Wien, Austria
3
Department of Experimental Physics, Faculty of Mathematics, Physics, and Informatics, Comenius University, 842 48 Bratislava, Slovakia
4
Department of Astronomy, Physics of the Earth, and Meteorology, Comenius University, 842 48 Bratislava, Slovakia
★ Corresponding authors: This email address is being protected from spambots. You need JavaScript enabled to view it.
; This email address is being protected from spambots. You need JavaScript enabled to view it.
Received:
30
September
2025
Accepted:
22
March
2026
Abstract
Aims. We quantify the uncertainty in space debris contributions to night sky brightness by comparing predictions from two major debris environment models and assessing the resulting signal-to-noise degradation for ground-based astronomical observations.
Methods. We compared debris population predictions from ESA’s MASTER and NASA’s ORDEM models, which differ in terms of their sub-millimeter particles by several orders of magnitude, due to divergent fragmentation assumptions. We calculated the debris-induced sky brightness contributions for six observatories worldwide and performed a detailed signal-to-noise analysis for VLT/FORS2 observations of extended sources ranging from 22 to 27 mag/arcsec2.
Results. MASTER predicts debris contributions of 29.7–30.3 mag/arcsec2 for zenith observations in 2024, while ORDEM-scaled estimates yield 26.2–26.8 mag/arcsec2. By 2035, these values will end up reaching 28.7–29.5 and 25.2–25.8 mag/arcsec2 respectively, representing 3–20% of natural sky brightness depending on model assumptions. For faint extended sources (27 mag/arcsec2), the S/N degradation ranges from 7% (MASTER) to 20% (ORDEM-scaled) over the next decade, potentially requiring 8–34% longer exposures to maintain sensitivity. The debris-induced brightness follows an 11-year solar cycle modulation, with 20–30% variations between solar maximum and minimum.
Conclusions. Model uncertainties, spanning an order of magnitude, prevent definitive predictions to be made on the impact of debris on astronomy. While large telescopes observing faint sources could face challenges under worst-case scenarios, smaller facilities with brighter sky-limited magnitudes remain relatively unaffected. Improved debris characterization through in-situ measurements or enhanced tracking is essential for reliable planning of future astronomical facilities. Signal-to-noise calculations isolate debris-specific degradation using debris brightness alone, providing observatories with debris-isolated planning metrics that are independent of local sky conditions.
Key words: atmospheric effects / light pollution / methods: numerical / space vehicles / telescopes
© The Authors 2026
 Open Access article, published by EDP Sciences, under the terms of the Creative Commons Attribution License (https://creativecommons.org/licenses/by/4.0), which permits unrestricted use, distribution, and reproduction in any medium, provided the original work is properly cited.
This article is published in open access under the Subscribe to Open model. This email address is being protected from spambots. You need JavaScript enabled to view it. to support open access publication.
1. Introduction
The proliferation of artificial space objects presents an emerging challenge to ground-based astronomical observations. While recent studies have extensively documented the impact of satellite constellation streaks on wide-field surveys (Tyson et al. 2020; Hainaut & Williams 2020; Mróz et al. 2022), the diffuse night sky brightness (NSB) increase caused by small space debris particles remains poorly quantified due to large uncertainties in debris population models. Unlike discrete satellite trails that can be masked or avoided through observation scheduling, this uniform background enhancement potentially affects the signal-to-noise ratio (S/N) for astronomical observations, particularly for faint targets where sky noise contributes significantly to the total noise budget.
The population of sub-10 cm debris objects, primarily generated through fragmentation events and collisions, vastly outnumbers trackable satellites. These particles, ranging from sub-millimeter to several centimeters, collectively scatter sunlight to create a measurable increase in sky brightness. Kocifaj et al. (2021) first predicted that this effect could increase NSB by 10–12% above natural levels by 2030–2035. Kocifaj et al. (2025) subsequently demonstrated how satellite fragmentation rates critically affect these predictions through the breakup of LEO satellites into smaller particles. However, these analyses relied on single debris population models without addressing the substantial uncertainties in debris size distributions across different modeling frameworks. Given that natural V-band sky brightness at mountain observatories is typically ∼100 μcd/m2 (Garstang 1989; Patat 2008), these model differences translate to debris contributions ranging from ∼3% (MASTER) to ∼20% (ORDEM-scaled) of the total background. This is a critical uncertainty since the total scattered light scales with the cumulative cross-sectional area of debris, which highly depends on how larger objects fragment into smaller particles. This process was first described by Kessler & Cour-Palais (1978) as potentially leading to cascading collision events.
Two primary models exist for characterizing the space debris environment: ESA’s MASTER (Flegel et al. 2011) and NASA’s ORDEM (Matney et al. 2019). While both models agree on the total mass of debris in low Earth orbit, they diverge by orders of magnitude in their treatment of fragmentation, particularly for particles smaller than 3 mm (Horstmann et al. 2021). This discrepancy has significant implications for astronomical observations, yet no study has quantitatively compared their predictions for NSB enhancement or assessed the resulting range of impacts on observatory performance. Current projections suggest the debris population will increase by 60% by 2035 based on existing fragmentation rates (European Space Agency 2023), but the actual impact on sky brightness remains highly uncertain due to these model discrepancies. Furthermore, existing studies, including Kocifaj et al. (2025), have not translated NSB increases into concrete S/N degradation values that would directly affect observational capabilities and survey efficiency.
This Letter presents the first comparative analysis of NSB predictions from MASTER and ORDEM debris models, revealing order-of-magnitude differences in their estimates for small particle contributions. Building on the framework established in Kocifaj et al. (2025), we quantify the resulting S/N degradation for astronomical observations across different object magnitudes and observing conditions, demonstrating potential impacts ranging from negligible to 20% depending on model assumptions and target brightness. Our analysis spans the period 2024–2035, incorporating solar cycle effects on atmospheric density and debris lifetime. We calculate the NSB increases for six representative observatories, including the Very Large Telescope (VLT), Vera Rubin Observatory (LSST), Zwicky Transient Facility (ZTF), Pan-STARRS, Leopold Figl Observatory, and Quito Astronomical Observatory. This approach allows us to illustrate the global scale of the problem across different latitudes and instrumental configurations, with detailed S/N analyses performed for VLT/FORS2 in a manner that is representative of modern 8-m class telescopes.
2. Methodology
2.1. Debris population models
We compared predictions drawn from two established debris environment models, noting that our treatment of ORDEM represents a scaling approximation rather than the full model implementation. ESA’s MASTER-8 (Flegel et al. 2011) and NASA’s ORDEM 3.1 (Matney et al. 2019) both characterize the spatial density and size distribution of debris objects in Earth orbit, but employ fundamentally different approaches to fragmentation modeling. MASTER uses a semi-deterministic approach based on historical fragmentation events, while ORDEM employs a statistical Bayesian framework calibrated against radar and optical measurements.
The critical difference lies in their treatment of subcentimeter particles. Following Horstmann et al. (2021), we find that ORDEM predicts up to 100 times more objects smaller than 3 mm compared to MASTER, while predicting only half as many objects larger than 3 mm. This discrepancy affects NSB calculations because fragmenting an object of radius R into k3 smaller objects of radius R/k increases the total cross-sectional area by a factor of k. Therefore, the higher fragmentation degree in ORDEM leads to enhanced collective scattering. However, due to the exact ratio of small objects in the ORDEM and MASTER models not being constant (i.e., fluctuating), we needed to use a value of 30 representing an average ratio.
To explore the range of uncertainty implied by these different modeling approaches, we generated two sets of predictions: (1) using unmodified MASTER data and (2) applying scaling factors to approximate ORDEM’s size distribution (multiplying concentrations by 0.5 for objects > 3 mm and by 30 for objects < 3 mm, representing an average value). We emphasize that these ORDEM-scaled estimates represent a simplified approximation to illustrate the potential range of impacts, not a full implementation of the ORDEM model. We refer to Appendix A for detailed model comparison, scaling justification, and validation using spatial density distributions. We consider debris populations for 2024 (current) and 2035 (projected), with the latter including a 60% increase based on current fragmentation rates (European Space Agency 2023).
2.2. Radiative transfer calculations
The sky brightness contribution from debris is calculated using the radiative transfer framework described in Kocifaj et al. (2021), extended to account for multiple scattering and realistic material properties. For each debris particle at a position, r, with a radius, a, the scattered radiance is
 (1)
(1)
where n(a, r) is the size-dependent spatial density from the debris model, σscat is the scattering cross-section, P(θ) is the scattering phase function for the Sun-debris-observer angle θ, F⊙ is the solar irradiance, and τatm accounts for atmospheric extinction. Material properties are derived from spectroscopic measurements of retrieved debris (Vananti et al. 2017). MASTER’s nine debris source types are assigned material compositions based on their physical origin. The complete material compositions and optical properties are documented in Appendix B.
We computed all-sky brightness maps for each observatory location, accounting for Earth’s shadow, solar phase angles, and atmospheric refraction. The aerosol optical depth is set to 0.1 (typical for mountain observatories) with a scale height of 1.54 km. We performed calculations for astronomical twilight conditions (solar elevation −18°) when debris remains illuminated and the sky is dark. These calculations provide the debris contribution to sky brightness, which must be considered alongside natural sources when evaluating total observational impacts.
2.3. Signal-to-noise impact assessment
The S/N degradation due to increased sky brightness is quantified following standard CCD photometry equations (Newberry 1991). With all the input values available, the S/N can be calculated via
![Mathematical equation: $$ \begin{aligned} \frac{S}{N}=\frac{C_0}{[C_0 +n\sigma _{\rm bg}^2(1+\frac{1}{p})]^{1/2}} ,\end{aligned} $$](/articles/aa/full_html/2026/04/aa57485-25/aa57485-25-eq2.gif) (2)
(2)
where C0 is the total number of counts being attributable to the object, while the sky level underneath the object is estimated by sampling the local background using some number, p, of background pixels. Then, σbg describes the variance in counts from the sky background.
This formulation assumes Poisson-distributed noise from the sky background. Critically, our calculations isolate the debris-specific effect by using only debris-induced sky brightness (Table 1 values) in the background noise term σbg, excluding natural sky brightness (∼100 μcd/m2 or 21.5 mag/arcsec2 in the V band at dark sites; Patat 2008). In practical observations where natural sky dominates, total S/N impact would be lower, but our debris-only approach enables direct assessment of the debris-specific contribution.
Sky brightness contribution from small debris (< 10 cm) for selected observatories.
We perform detailed S/N degradation calculations for VLT/FORS2, chosen as representative of modern 8-m class telescopes. FORS2 operates with 0.25 arcsec pixels and two readout modes (100 kHz and 200 kHz), allowing us to assess the impact across different observing strategies. We consider extended sources ranging from magnitude 22–27 mag/arcsec2, spanning bright nebulae to the faintest detectable low surface brightness galaxies. Calculations are performed for zenith angles of 0°, 30°, and 60° to capture the variation with airmass. Additionally, we compute the Johnson V-filter S/N for the Leopold Figl Observatory (1.5-m aperture) to assess impacts on smaller facilities.
While we calculated NSB increases for all six observatories (including LSST and ZTF), the S/N degradation analysis focuses on facilities where detailed instrumental parameters were available. The NSB values for LSST and ZTF provide context for the scale of the problem across different telescope classes.
3. Results
Building on the NSB calculations presented in Kocifaj et al. (2025), we focus here on the observational implications of model uncertainties. The small debris population (< 10 cm) creates a persistent enhancement of the night sky background, with substantial differences emerging between model predictions. Table 1 presents the sky brightness contribution from debris for three representative observatories, revealing both the current estimated impact and projected evolution. For zenith observations in 2024, the MASTER model predicts debris-induced brightness of 29.7–30.3 mag/arcsec2 across different sites, while ORDEM-scaled estimates yield substantially brighter contributions at 26.2–26.8 mag/arcsec2. This 3.5 magnitude difference represents approximately a factor of 25 in terms of sky brightness, comprising a range that reflects the fundamental uncertainty in current debris population models. The divergence stems from different fragmentation assumptions: ORDEM predicts approximately 30 times more particles smaller than 3 mm compared to MASTER, while predicting only half as many objects larger than 3 mm. By 2035, both models project increased contributions, with ORDEM-scaled values reaching 25.2–25.8 mag/arcsec2, corresponding to 5–19 μcd/m2. When considered alongside natural V-band sky brightness of ∼100 μcd/m2 at dark sites, this represents an additional 5–20% increase in total background under ORDEM-scaled assumptions (or 3–8% under MASTER predictions). The 3.5 magnitude difference reflects enhanced small-particle population. Sub-centimeter particles dominate: 1–10 mm for MASTER, 0.1–1 mm for ORDEM-scaled, validating our scaling approach (see Appendix A). Maximum debris brightness occurs at 30°–60° elevation, decreasing toward the antisolar direction and within Earth’s shadow.
The increased NSB from debris contributes additional noise that affects S/N ratios for astronomical observations. For faint extended sources (27 mag/arcsec2), the ORDEM-scaled model predicts the S/N could decrease by up to 20.2% over this decade due to increasing debris, while the conservative MASTER model yields a 7.3% decrease. These values represent upper bounds, as they do not account for the dominant contribution of natural sky brightness. When combined with natural sky brightness of ∼21.5 mag/arcsec2, the debris contribution represents an additional 3–20% increase in background, depending on the model. This degradation is most significant for observations of faint sources where sky noise dominates the error budget.
Table 2 presents the S/N decrease from 2024 to 2035 for different object magnitudes and zenith angles, demonstrating how the impact scales with target brightness and airmass. The degradation is most severe for observations of faint sources where sky noise dominates the error budget. For bright objects (22 mag/arcsec2), the S/N decrease remains below 1% for MASTER predictions, but reaching up to 10% for ORDEM-scaled estimates over the decade. These ranges illustrate the substantial uncertainty in impact assessment arising from debris model differences.
S/N degradation from 2024 to 2035 for VLT/FORS2 observations (200 kHz readout mode).
The readout mode selection influences the severity of S/N degradation. FORS2’s 100 kHz mode, with higher read noise, shows slightly worse degradation (up to 21% decrease for faint objects under ORDEM-scaled assumptions) compared to the 200 kHz mode (20.4% decrease). This difference becomes negligible for brighter targets where photon noise dominates.
For comparison, we also analyzed the Leopold Figl Observatory’s 1.5-m telescope, which represents smaller facilities operating under less pristine conditions. With a sky-limited magnitude of approximately 22.3 mag/arcsec2 in V-band, this facility cannot detect the faint sources most affected by debris. The ORDEM-scaled model predicts S/N decreases of 11% from 2024 to 2035 at its detection limit (22 mag/arcsec2), while the MASTER model predicts negligible impact below 1%. This demonstrates that smaller facilities operating under brighter skies face limited impact from debris-induced NSB.
To understand the practical implications for observatory operations, we convert the S/N degradation into required exposure time increases. Since S/N scales with the square root of exposure time, maintaining constant S/N as debris accumulates requires longer observations. For a fractional S/N decrease of f, the exposure time must increase by a factor of (1/(1 − f))2. Thus, the 20.2% S/N degradation for faint sources under ORDEM-scaled predictions could translate to an increase of up to 34% in exposure time by 2035; however, we note that more conservative MASTER predictions suggest only 8% increases. Figure 1 illustrates this relationship across the magnitude range. These potential exposure time increases would affect survey efficiency: a deep survey requiring 100 hours in 2024 could require up to 134 hours in 2035 under worst-case ORDEM-scaled predictions, effectively reducing the number of fields that can be observed per season. However, we emphasize that these represent upper bounds from our debris-only methodology and uncertain model extrapolations. For time-domain astronomy, where rapid follow-up is essential, even modest degradation could affect the ability to characterize fast-evolving transients.
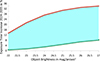 |
Fig. 1. Additional exposure time required in 2035 to maintain 2024 S/N for VLT/FORS2 observations, averaged over zenith angles 0°–60°. The shaded region highlights the critical uncertainty between debris models: faint galaxy observations (27 mag/arcsec2) require either 8% (MASTER, lower curve) or 34% (MASTER/ORDEM-scaled, upper curve) longer exposures, directly impacting survey efficiency and time-domain astronomy capabilities. |
4. Discussion and conclusion
The order-of-magnitude difference between MASTER and ORDEM-scaled predictions highlights the substantial uncertainty in current debris population models. This uncertainty stems from different fragmentation approaches: ORDEM’s prediction of 100 times more sub-3mm particles translates to enhanced collective scattering. Under ORDEM-scaled predictions, debris could contribute up to 20 μcd/m2, although this remains well below the natural sky brightness of 100 μcd/m2 at dark sites. The resulting S/N degradation ranges from 8% (MASTER) to 34% (ORDEM-scaled) additional exposure time for faint sources by 2035, which is a four-fold uncertainty that complicates planning for future facilities.
Our analysis reveals a dichotomy in impact severity. While 8-m class telescopes at pristine sites may face challenges for faint-object astronomy under worst-case scenarios, smaller facilities like the 1.5-m Leopold Figl Observatory experience minimal impact due to their brighter sky-limited magnitudes. This differential impact could reshape astronomical research priorities, with faint-object studies potentially becoming more concentrated at the largest facilities that can overcome debris-induced degradation through collecting area.
An important limitation is that we present debris contributions separately from total sky brightness. For dark-sky conditions (21.5 mag/arcsec2), adding ORDEM-scaled debris (26 mag/arcsec2) yields modest (but potentially significant) photometric precision. Future work should integrate debris models with comprehensive sky brightness predictions.
Our analysis reveals that the debris-induced NSB evolution appears to be modulated by the 11-year solar cycle. The NSB contribution in 2030 (solar minimum) exceeds that in 2035 (solar maximum) by approximately 20–30%, despite continuous debris generation. This occurs because enhanced atmospheric density during solar maxima increases orbital decay rates, temporarily reducing the small particle population. This periodic variation means observatories will experience windows of relatively improved conditions during solar maxima, followed by more rapid degradation during solar minima. This pattern should be considered when scheduling long-term surveys.
These model uncertainties underscore the need for improved debris characterization to enable informed planning for future astronomical facilities. The order-of-magnitude uncertainty between MASTER and ORDEM-scaled predictions represents a significant knowledge gap for planning facilities with decades-long development timelines. Resolving this discrepancy through improved debris characterization (e.g., via in situ measurements, laboratory experiments on fragmentation, or enhanced tracking of small objects) is essential for quantifying the actual risk to ground-based astronomy. Until then, observatory planning must consider both optimistic and pessimistic scenarios, with the understanding that actual impacts likely fall somewhere within this broad range.
Acknowledgments
This work was supported by the Slovak Research and Development Agency under contract No: APVV-22-0020, APVV-24-0627 and ESA Contract No. 4000139802/22/NL/SC. Computational work was supported by the Slovak National Grant Agency VEGA (grant No. 2/0010/20). This work is part of the project for which the financial means was funded by the European Union’s Horizon 2020 Research and Innovation Programme on the basis of the Grant Agreement under the Marie Skłodowska-Curie funding mechanism No. 945478 – SASPRO 2 / Proj. Number 1384/03/01.
References
- European Space Agency 2023, ESA’s Annual Space Environment Report, Tech. rep, ESA Space Debris Office [Google Scholar]
- Flegel, S., Oswald, M., Stabroth, S., & Alag, C. 2011, Software User Manual, MASTER 2009, Tech. Rep. RFQ No: 21705/D/HK, Revision: 1.1, Institute of Aerospace Systems (ILR), Technische Universität Braunschweig [Google Scholar]
- Garstang, R. H. 1989, PASP, 101, 306 [Google Scholar]
- Hainaut, O. R., & Williams, A. P. 2020, A&A, 636, A121 [EDP Sciences] [Google Scholar]
- Horstmann, A., Manis, A., Braun, V., et al. 2021, in Proceedings of 8th European Conference on Space Debris, Darmstadt, Germany [Google Scholar]
- Kessler, D. J., & Cour-Palais, B. G. 1978, J. Geophys. Res., 83, 2637 [CrossRef] [Google Scholar]
- Kocifaj, M., Kundracik, F., Barentine, J. C., & Bará, S. 2021, MNRAS, 504, L40 [NASA ADS] [CrossRef] [Google Scholar]
- Kocifaj, M., Kundracik, F., & Wallner, S. 2025, MNRAS, 541, L47 [Google Scholar]
- Matney, M., Manis, A., Anz-Meador, P., et al. 2019, First International Orbital Debris Conference, NASA Houston [Google Scholar]
- Mróz, P., Otarola, A., Prince, T. A., et al. 2022, ApJ, 924, L30 [CrossRef] [Google Scholar]
- Newberry, M. V. 1991, PASP, 103, 122 [NASA ADS] [CrossRef] [Google Scholar]
- Patat, F. 2008, A&A, 481, 575 [NASA ADS] [CrossRef] [EDP Sciences] [Google Scholar]
- Tyson, J. A., Ivezić, Ž., Bradshaw, A., et al. 2020, AJ, 160, 226 [Google Scholar]
- Vananti, A., Schildknecht, T., & Krag, H. 2017, Adv. Space Res., 59, 2488 [Google Scholar]
Appendix A: Debris model comparison and scaling methodology
A.1. Differences between MASTER and ORDEM
Both MASTER-8 (Flegel et al. 2011) and ORDEM 3.1 (Matney et al. 2019) predict similar total debris mass in LEO but differ dramatically in their size distribution assumptions. MASTER-8 provides debris concentrations in 5° latitude intervals and 100 km altitude intervals, organizing objects into nine source categories (explosion fragments, collision fragments, launch- and mission-related objects, NaK droplets, solid rocket motor slag and dust, paint flakes, surface degradation ejecta, and multi-layer insulation fragments). ORDEM 3.1 uses a different spatial discretization and categorizes debris into five broad density classes.
The most significant divergence appears in the sub-centimeter regime. As documented by Horstmann et al. (2021), ORDEM 3.1 predicts approximately 100 times more objects smaller than 3 mm and approximately half as many objects larger than 3 mm compared to MASTER-8, while both models converge on similar total mass estimates. This discrepancy reflects different assumptions about fragmentation physics and debris evolution.
A.2. Justification for MASTER-based scaling
We chose to scale MASTER-8 concentrations rather than using ORDEM 3.1 directly for three reasons. First, MASTER-8 provides finer spatial resolution (5° latitude bins vs. ORDEM’s coarser binning), enabling more accurate line-of-sight integration for specific observatory locations. Second, MASTER-8’s nine debris source categories enable detailed material composition mapping based on debris origin, whereas ORDEM’s five density categories provide less information about material properties. Third, scaling MASTER’s spatial structure with ORDEM’s size distribution allows us to isolate the effect of size distribution uncertainty while maintaining consistent spatial modeling.
A.3. Scaling factors and physical basis
Our scaling approach modifies MASTER-8 concentrations by:
-
Objects > 3 mm: multiply concentrations by 0.5
-
Objects < 3 mm: multiply concentrations by 30
The 3 mm threshold was chosen based on Horstmann et al. (2021)’s analysis showing this as the approximate crossover point between the two models. The factor-30 enhancement for small particles reflects ORDEM’s prediction of greatly increased fragmentation. While a continuous scaling function would be more physically realistic, implementing this requires access to ORDEM’s full size distribution data at each spatial location, which is not publicly available. Our two-step approximation captures the first-order effect: enhanced small-particle populations.
The physical basis follows from fragmentation scaling laws. If an object of radius R fragments into pieces of radius R/k, the number of fragments scales as k3 (volume conservation) while individual cross-sections scale as k−2. The total cross-sectional area therefore increases by a factor of k, directly increasing scattered light by the same factor. Our factor-30 enhancement for small particles implies an effective fragmentation increase that produces the observed brightness enhancement.
We acknowledge this approach introduces a non-physical discontinuity at 3 mm. However, this simplified model successfully reproduces ORDEM’s enhanced small-particle contribution while maintaining MASTER’s validated spatial structure. The resulting brightness predictions should be interpreted as bracketing the range of uncertainty implied by current debris models (and not as precise bounds).
A.4. Validation using spatial density distributions
Figure A.1 compares spatial density profiles from MASTER-8, ORDEM 3.1, and our MASTER/ORDEM-scaled approximation. For objects > 1 mm (left panel), our scaled MASTER concentrations closely match ORDEM’s distribution across the critical 400–800 km altitude range. For objects > 1 cm (right panel), the factor-0.5 reduction brings MASTER into agreement with ORDEM’s lower concentrations at LEO altitudes. This validates our scaling approach for the size regimes that dominate night sky brightness contributions.
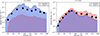 |
Fig. A.1. Comparison of spatial density vs. altitude for objects > 1 mm (left) and > 1 cm (right). Red shaded area: MASTER-8 model. Blue shaded area: ORDEM 3.1 model. Black dots: our MASTER/ORDEM-scaled approximation. MASTER-8 and ORDEM 3.1 data digitized from Horstmann et al. (2021), their Fig. 1 (top panels). The scaling factors (0.5× for > 3 mm, 30× for < 3 mm) successfully reproduce ORDEM’s enhanced small particle population in critical size regimes while maintaining MASTER’s spatial structure. |
Appendix B: Material properties and debris composition
MASTER-8’s nine debris source types enable detailed material composition modeling based on debris origin. Table B.1 shows the fractional composition of each debris type, derived from analysis of retrieved debris samples and spacecraft construction databases. Table B.2 provides the optical properties (Bond albedo ρ and specular/diffuse mixing coefficient β) for each material type, based on spectroscopic measurements (Vananti et al. 2017).
Material composition by debris source type.
Appendix C: Signal-to-noise methodology and instrument parameters
C.1. Complete signal-to-noise formulation
We can calculate aperture photometry S/Ns using the CCD equation (Newberry 1991), which is expressed as
 (C.1)
(C.1)
where Nsource is the total detected electrons from the source, npix is the number of pixels in the photometric aperture, Nsky is detected electrons per pixel from sky background, Ndark is dark current electrons per pixel, and R is readout noise in electrons.
For extended sources (surface brightness measurements), we compute Nsource from
 (C.2)
(C.2)
where F0 is the zero-point flux, m is source surface brightness in mag/arcsec2, A is telescope collecting area, η is optical system efficiency, QE is detector quantum efficiency, t is exposure time, and pixel area is in arcsec2.
Sky background follows the same calculation with m replaced by sky surface brightness. Critically, for our debris-only calculations, sky surface brightness uses only debris-induced values from Table 1, excluding the natural sky background.
Optical properties by material type.
C.2. VLT/FORS2 instrument parameters
Table C.1 provides complete instrument parameters for VLT/FORS2 used in our calculations. FORS2 offers two CCD detectors (E2V and MIT) with different quantum efficiencies and two readout modes (100 kHz and 200 kHz) with different readout noise characteristics.
VLT/FORS2 instrument parameters for S/N calculations.
C.3. Leopold Figl Observatory parameters
Table C.2 provides parameters for Leopold Figl Observatory, University of Vienna’s 1.5 m telescope. This mid-aperture facility represents typical university research telescopes.
Leopold Figl Observatory instrument parameters.
Appendix D: Comprehensive debris impact data
This appendix provides complete numerical results for all six observatories analyzed in this study. Tables D.1–D.4 present night sky brightness values, S/N degradation percentages, and required exposure time increases for both debris models across all zenith angles and instrument configurations.
Night sky brightness contribution from small debris (< 10 cm) for all observatories analyzed.
S/N degradation 2024 to 2035 for VLT/FORS2 due to increasing debris-induced sky brightness.
S/N degradation 2024 to 2035 for Leopold Figl Observatory (1.5-m telescope, Johnson V-filter).
Exposure time increase required by 2035 to maintain 2024 S/Ns for VLT/FORS2 observations.
The azimuth dependence of debris-induced NSB can be substantial (Kocifaj et al. 2025). For our baseline calculations, we selected azimuth angles to maximize equatorial debris intersection: north-pointing (0°) for VLT and LSST (southern hemisphere); south-pointing (180°) for ZTF and Leopold Figl (northern hemisphere); and east-pointing (90°) for Quito (equatorial). Pan-STARRS uses north-pointing (0°) for comparison with LSST despite its northern location.
All Tables
Sky brightness contribution from small debris (< 10 cm) for selected observatories.
S/N degradation from 2024 to 2035 for VLT/FORS2 observations (200 kHz readout mode).
Night sky brightness contribution from small debris (< 10 cm) for all observatories analyzed.
S/N degradation 2024 to 2035 for VLT/FORS2 due to increasing debris-induced sky brightness.
S/N degradation 2024 to 2035 for Leopold Figl Observatory (1.5-m telescope, Johnson V-filter).
Exposure time increase required by 2035 to maintain 2024 S/Ns for VLT/FORS2 observations.
All Figures
|
Fig. 1. Additional exposure time required in 2035 to maintain 2024 S/N for VLT/FORS2 observations, averaged over zenith angles 0°–60°. The shaded region highlights the critical uncertainty between debris models: faint galaxy observations (27 mag/arcsec2) require either 8% (MASTER, lower curve) or 34% (MASTER/ORDEM-scaled, upper curve) longer exposures, directly impacting survey efficiency and time-domain astronomy capabilities. |
| In the text | |
|
Fig. A.1. Comparison of spatial density vs. altitude for objects > 1 mm (left) and > 1 cm (right). Red shaded area: MASTER-8 model. Blue shaded area: ORDEM 3.1 model. Black dots: our MASTER/ORDEM-scaled approximation. MASTER-8 and ORDEM 3.1 data digitized from Horstmann et al. (2021), their Fig. 1 (top panels). The scaling factors (0.5× for > 3 mm, 30× for < 3 mm) successfully reproduce ORDEM’s enhanced small particle population in critical size regimes while maintaining MASTER’s spatial structure. |
| In the text | |
Current usage metrics show cumulative count of Article Views (full-text article views including HTML views, PDF and ePub downloads, according to the available data) and Abstracts Views on Vision4Press platform.
Data correspond to usage on the plateform after 2015. The current usage metrics is available 48-96 hours after online publication and is updated daily on week days.
Initial download of the metrics may take a while.