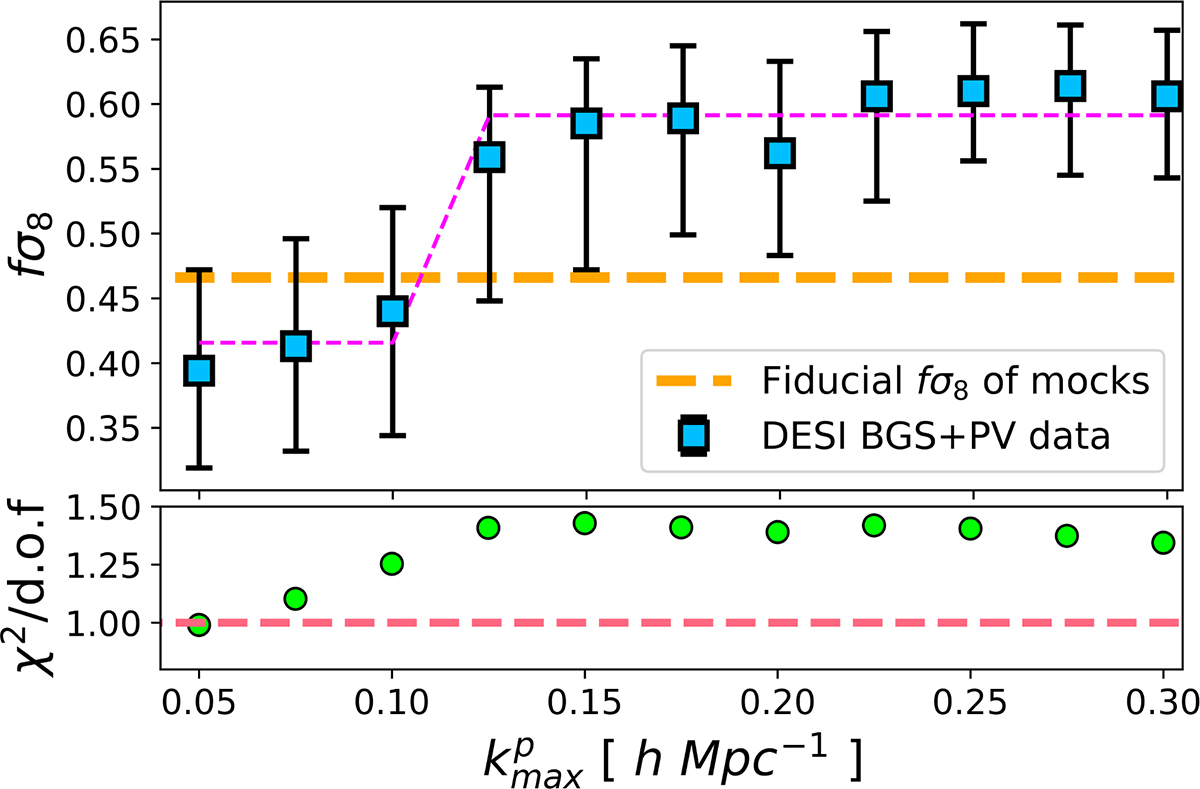
Fig. 10.
Download original image
In the top panel, the filled blue squares show the estimated growth rate, fσ8, as a function of the cut-off wave number, kmaxp, of the momentum power spectrum. We fixed kmax = 0.3 h Mpc−1 for the density and cross power spectrum. They were derived from the BGS and DESI-PV survey data. The dashed magenta line indicates the average of the filled blue squares. The dashed yellow line indicates the fiducial value fσ8 = 0.466 of mocks. The bottom panel illustrates the reduced χ2 values for each measurement, depicted by filled green circles.
Current usage metrics show cumulative count of Article Views (full-text article views including HTML views, PDF and ePub downloads, according to the available data) and Abstracts Views on Vision4Press platform.
Data correspond to usage on the plateform after 2015. The current usage metrics is available 48-96 hours after online publication and is updated daily on week days.
Initial download of the metrics may take a while.