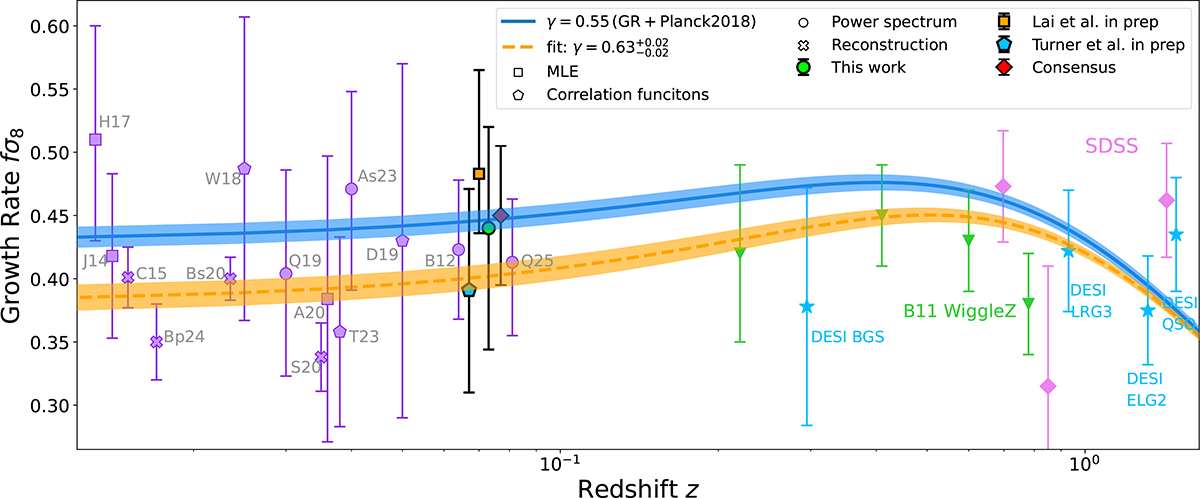
Fig. 13.
Download original image
Growth rate, fσ8, as a function of redshift, z. The blue curve represents the theoretical prediction derived under the assumption of GR (γ = 0.55) and a ΛCDM cosmology calibrated using Planck Collaboration VI (2020). The filled green circle denotes the measurement obtained in this study. The filled orange square corresponds to the result from Lai et al. (2025, using MLE), based on the same dataset, while the filled blue pentagon reflects the measurement from Turner et al. (2025, using correlation functions), also utilizing identical data. The filled red diamond corresponds to the consensus result of these three measurements. Additional observational constraints are illustrated by purple circles (using power spectrum), purple squares (using MLE), a purple cross (using reconstruction), and purple pentagons (using correlation functions), representing measurements from other surveys. The light blue pentagrams corresponds to the results from DESI DR1. The dashed orange curve indicates the model fits to all the data points, with the shaded orange region depicting the associated uncertainties.
Current usage metrics show cumulative count of Article Views (full-text article views including HTML views, PDF and ePub downloads, according to the available data) and Abstracts Views on Vision4Press platform.
Data correspond to usage on the plateform after 2015. The current usage metrics is available 48-96 hours after online publication and is updated daily on week days.
Initial download of the metrics may take a while.